Invited Symposium: Behaviour-Induced Neural Events after Brain Injury
| INABIS '98 Home Page | Your Session | Symposia & Poster Sessions | Plenary Sessions | Exhibitors' Foyer | Personal Itinerary | New Search |
Materials and Methods
Animals
For the study of Sv nine male Albino rats (350-400 g, Hilltop Laboratories, PA) were randomly assigned to 3 experimental groups of 3 rats each: 1) Dehydration (D, n=3), was induced by substitution of normal drinking water with 2% saline for 7 days, an osmotic challenge that activates neurosecretory neurons to release oxytocin and vasopressin (Jones and Pickering, 1969; Dyball and Garten, 1988) ; 2) Rehydration (D/R, n=3) was induced by substitution of normal drinking water with 2% saline for 7 days followed by free access to tap water for 7 days; and 3) The control (C, n=3) group which had free access to tap water. An additional set of rats was used to estimate glial cell number (Nv) in the VGL. The experimental groups and dehydration protocol were identical to the those used for the estimation of Sv except that each group contained seven subjects. Each rat was individually housed during the experiment and fed ad libitum. Immunohistochemistry
All animals were deeply anaesthetized with Nembutal (150 mg/kg) and perfused transcardially with 100 ml 0.1 M phosphate buffer (pH 7.6 at 25 °C) followed by fixation with 400 ml 4% paraformaldehyde in 0.1 M phosphate buffer, 25 °C. The brains were removed and post- fixed overnight in the latter perfusate. They were then cryoprotected in 30% buffered sucrose for 24-48 hours, sectioned at a 26 µm thickness on a freezing microtome and stored in 0.1 M phosphate buffer with 0.1% sodium azide. To maintain uniform staining characteristics across experimental conditions all groups were perfused and sectioned together. All sections were then simultaneously processed for immunocytochemistry in the same tray.
The SON was sampled by choosing sections at 300 µm intervals along the anterior to posterior extent of the nucleus. This provided a series of sections that reflected the regional morphology of the SON: an anterior region with MNCs in a single row oriented parallel to the pial surface, a middle region with multiple rows of MNCs, and a posterior region with MNCs oriented parallel to the optic tract. The SON MNC region and the SON-VGL were easily recognized in all sections that were examined.
The sections were processed free-floating for peroxidase immunohistochemistry. They received an initial 1h incubation at room temperature in 0.3% hydrogen peroxide in 10 mM phosphate buffed saline (PBS pH 7.3) to inactivate endogenous peroxidase followed by washing 3 X 10 min in 10 mM PBS. The sections were then incubated for 16-20 h, 4 °C, in 10 mM PBS containing 10% horse serum (HS) to block background staining and 0.5% triton X-100. After being washed 3 X 10 min in 10 mM PBS at room temperature and they were transferred to 10 mM PBS containing mouse anti-GFAP (1:500, ICN, Costa Mesa, CA, USA) with 0.5% triton X-100 and 2% HS at 4 °C for 16 h. The primary antibody incubation was followed by 3 X 10 min wash in PBS-2% HS. The primary was bound by a biotinylated anti-mouse secondary antibody, rat adsorbed (1:200, Vector Labs, Burlingame, CA, USA) diluted, in PBS for 1 h at room temperature. Sections were then incubated in avidin-biotin complex linked to peroxidase (ABC Kit, Vector Labs, Burlingame, CA, USA) according to the vendor's instructions. The peroxidase was visualized with 0.03% 3-3-diaminobenzidine hydrochloride, 0.6% nickel ammonium sulfate with 0.005% hydrogen peroxide in 0.1 M Tris buffer. Stained sections were mounted on 2% silane (Sigma Chemical Co. 1:3 in acetone) coated slides, dehydrated through graded alcohols, cleared in xylene and coverslipped. Negative control sections received identical treatment except that the primary antibody was omitted. Surface Density (Sv)
Estimates of the surface density (Sv) of GFAP-IR processes within the SON were made using the cycloid grid intercept method (Baddeley et al., 1986) in which intersections between the astrocytic processes and a set of test lines consisting of cycloid arcs arrayed in a complex, or staggered, arrangement are counted. These measurements were made on an Olympus BH-2 microscope connected to a DAGE video camera. A sample frame area of 104 mm2 containing a total test line length of 454 µm (adjusted for final magnification) was copied onto a clear transparency and overlayed on the projected images on the video screen. Figures 1 and 2 show the GFAP-IR processes as they appeared on the screen and the cycloid grid.
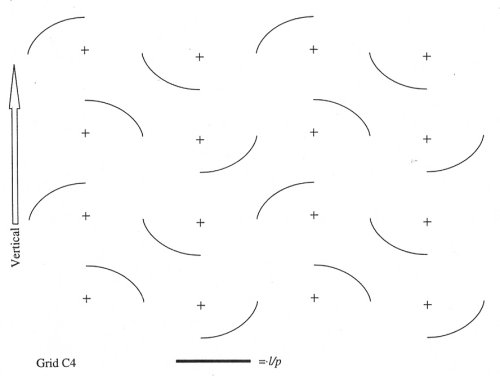 Fig.1: The cycloid grid that was superimposed over the astrocytic processes.
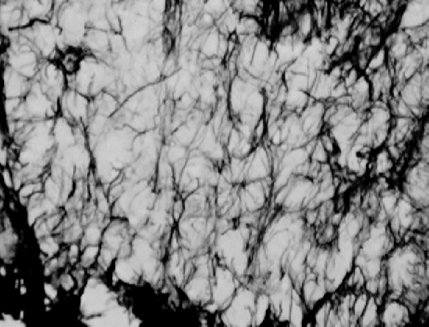 Fig.2: Astrocytes stained for GFAP as they appeared on the computer screen.
Nine sections were used for quantification beginning with the first distinct rostral appearance of the SON and moving caudally. From each section, six samples were obtained in the dorsal protion of the SON using a 100x oil immersion objective at a final magnification of 4400X. The first sample frame of the SON was positioned at the medial border of the SON near the optic fibers. Moving laterally, each subsequent sample was taken at a fixed distance of 130 µm from the previous sample. Similiar measures were made in the globus pallidus and lateral hypothalamic area; regions that served as controls for the specific effects of experimental manipulation. The original method (Baddeley et al., 1986) assumed a negligible section thickness compared to the object of interest. In the sample volumes used here, the diameter of astrocytic processes is smaller than the disector section thickness which results in overprojection bias of astrocytic process. However, the sampling with the cycloid was always done in a fixed optical plane within tissue and the projection bias is therefore minimal. While the present study is not free of projection bias, the Sv of astrocytic processes was, however, systematically overestimated to the same degree for all subjects. Surface density (Sv) was calculated using Equation 1, Sv = 2 (I/L). Sv (surface density) is the surface area per unit volume of tissue. I is the total number of intersections summed over all samples and L is the total test line length per layer for each subject (25920 µm). All surface density measurements were obtained at a depth of 10 µm from the top of the section. No correction was made for tissue shrinkage during histological processing. All quantitative measures were made on coded tissue. Numerical Density (Nv) Nissl
The additional set of subjects was used to produce a serial set of sections cut coronally with a vibratome at a thickness of 90 µm. The sections were mounted on slides and allowed to air dry. The mounted sections were rehydrated through descending alcohols, and stained with thionin, dehydrated with ascending alcohols, defatted in xylene, and coverslipped with Micromount. Optical Disector
The particle counting technique for obtaining Nv employed the principles of the 'disector' method (Sterio, 1983). In the original method, particles are counted if they occur within an unbiased counting frame in a "reference" section but not in a "lookup" section and are defined as particles belonging to the disector volume. The present method, the "optical disector," uses one relatively thick section of tissue instead of a pair of two thin sections. With the small focal depth of high numerical aperture oil immersion objective lenses, separate planes (i.e., "optical" reference and lookup sections) are studied within the section. While the stage was not equiped with an electronic microcator the vertical movements of the tissue relative to the objective lens were determined by using the calibration divisions on the manual focusing knob. This vertical movement, which was 30 µm in the present study, is equivalent to h in Equation 2. In practice, the investigator focused down through the section at least 10 µm and counted the new particles of interest (Q-,cells) when they first come into focus within the counting frame. Particles in the last 10 µm were not counted. The volume of the disector is the product of the area of the counting frame [a(fra)] and the distance between the reference and lookup planes. Equation 2. V(dis) = a(fra) x h. The ratio of Q- to the volume of the disectors (a(fra) x h x the number of disectors applied) gives the number of particles per unit volume of tissue (Nv) from: Equation 3. Nv = summation of Q-/ summation of V(dis). The superimposed counting frame upon the image of the tissue sections viewed on a monitor measured 695 µm2. An oil objective lens (100X, NA 1.40) was used when counting. The final magnification on the screen was 1800X.
A systematic placement of the counting frame within the SON-VGL was accomplished similar to the sampling strategy used for estimating Sv. As the section was moved from medial to lateral each subsequent sample was taken at a fixed distance of 60 µm from the previous sample. The SON as it appeared at low power magnification is shown in Figure 3.
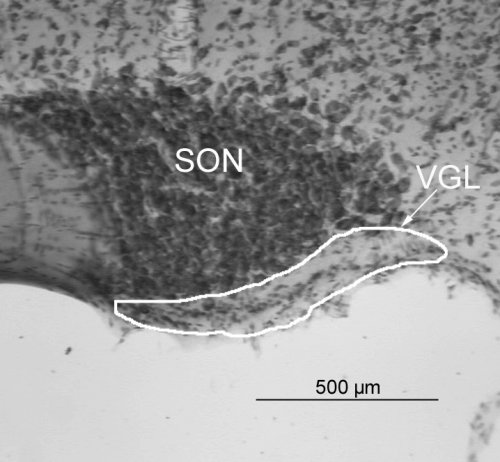 Fig.3: The SON-VGL is delineated by the white outline.
The identification of glia in the VGL-SON in the series of sections stained for thionin involved criteria of soma size and appearance; astrocytes in general were larger and more spherically shaped than microglia and endothelial cells.
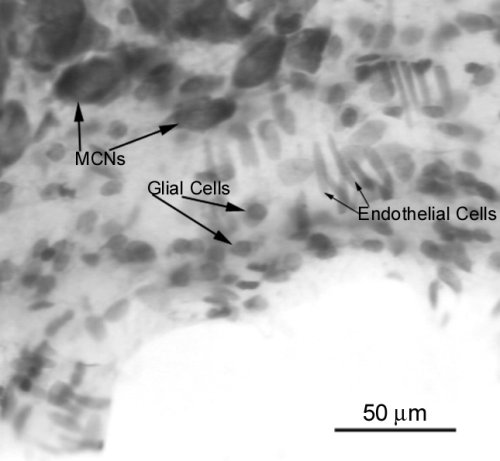 Fig.4: Glial cells could easily be differentiated from endothelial cells in the SON.
Statistical Analyses
Material from a total of 9 rats, 3 from each experimental group, was analyzed for Sv. The Nv was obtained from the additional set of 21 rats; 7 rats in each experimental group. All measures of Sv and Nv were made by investigators blind to the experimental conditions. Data are expressed as means ± SEMs. Statistical comparisons were carried out with a one-way analysis of variance (ANOVA). When significant effects were obtained, post-hoc comparisons between groups were performed using a Student-Neuman-Keuls test. A probability of < 0.05 was accepted as significant.
| <= Introduction | MATERIALS & METHODS | Results => |
| Discussion Board | Next Page | Your Symposium |