Invited Symposium: Hypertension III: Flow-Induced Vascular Remodeling
| INABIS '98 Home Page | Your Session | Symposia & Poster Sessions | Plenary Sessions | Exhibitors' Foyer | Personal Itinerary | New Search |
Results
Hemodynamic parameters
Same animal control and post-ligation hemodynamic parameters are summarized in Table 1. Data represent control and post-ligation meanÝSEM for arterial pressure, blood flow, vessel internal radius, and calculated wall shear rate (WSR): [(4Q)/(pi*r3) where Q = blood flow (ml/sec) and r = vessel radius (cm)]. Sample size is indicated in parentheses. Data were analyzed using a repeated measures ANOVA with a post-hoc Student-Newman-Keuls test and an alpha = 0.05. ** p<0.01; *** p<0.001 versus pre-ligation values.
Parameter Control Post-Ligation
Arterial pressure, mmHg
MAP 111.8Ý4.3 (8) 119.4Ý3.4 (8)
Second-order branch 91.0Ý2.6 (6) 88.3Ý5.7 (6)
Blood flow, ml/min
Ileal artery 0.65Ý0.08 (8) 0.83Ý0.07*(8)
Second-order branch 0.33Ý0.04 (8) 0.84Ý0.07***(8)
Internal radius, çm
Ileal artery 150.3Ý6.3 (8) 160.7Ý7.3***(7)
Second-order branch 130.2Ý8.9 (7) 136.8Ý6.0 (7)
WSR, sec-1
Ileal artery 4125Ý468 (8) 4545Ý630 (8)
Second-order branch 3832Ý647 (7) 7618Ý1193***(7)
Neither mean carotid nor local mesenteric arterial pressures were significantly different from control and post-ligation. Arterial blood flows through the ileal and second-order vessels were significantly elevated post-ligation, while only the ileal artery exhibited flow-mediated dilation. As a consequence, WSR was significantly elevated only in the second-order branch.
Morphological analysis
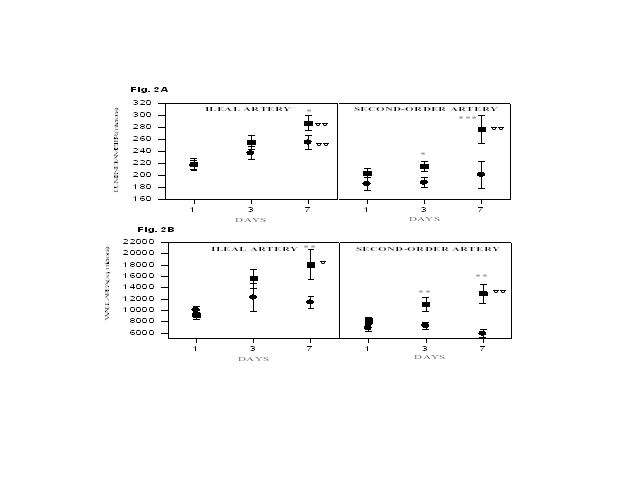
Figure 2 illustrates significant lumen expansion and medial wall hypertrophy in both order vessels after 1, 3, and 7 days of elevated flow. Significant increases in lumen diameter were observed in both the control and high flow ileal arteries. No other control vessel changed significantly with time; therefore, significant interactions between high flow and time were observed for ileal artery lumen expansion and for second-order artery increases in lumen diameter and medial wall area.
 Click to enlarge
Fig.2: Flow-induced changes in (A) lumen diameter and (B) medial wall area for ileal and second-order vessels. No interaction was detected between flow and time for ileal artery luminal enlargement, with both control and high flow vessels significantly increasing with time. Significant interactions between flow and time were detected for the second-order artery lumen diameter, as well as for changes in ileal and second-order artery wall area. Post-hoc independent comparisons of control versus treatment for each time point are indicated. Data were evaluated with a 2-way ANOVA using post-hoc Bonferroni-corrected T-tests. Values represent meanÝSEM, and n = 10 for each group. Between 3 and 6 cross-sections per vessel were analyzed. * p<0.05, ** p<0.01, *** p<0.001 versus control; U p<0.05, UU p<0.01 versus day.
Click to enlarge
Fig.2: Flow-induced changes in (A) lumen diameter and (B) medial wall area for ileal and second-order vessels. No interaction was detected between flow and time for ileal artery luminal enlargement, with both control and high flow vessels significantly increasing with time. Significant interactions between flow and time were detected for the second-order artery lumen diameter, as well as for changes in ileal and second-order artery wall area. Post-hoc independent comparisons of control versus treatment for each time point are indicated. Data were evaluated with a 2-way ANOVA using post-hoc Bonferroni-corrected T-tests. Values represent meanÝSEM, and n = 10 for each group. Between 3 and 6 cross-sections per vessel were analyzed. * p<0.05, ** p<0.01, *** p<0.001 versus control; U p<0.05, UU p<0.01 versus day.
Medial wall thickness-to-lumen diameter ratios did not change in any vessel at any time (data not shown). This suggests that vascular remodeling did not consist of preferential changes in either lumen diameter or wall thickness, thus acting to normalize wall stress within the 7 day period. The percent of connective tissue in the medial wall also remained constant throughout the 7 day period (data not shown), indicating that as the vessel walls hypertrophied in response to elevated flow, a concomitant increase in ECM-associated components occurred to maintain a normal medial wall vascular environment.
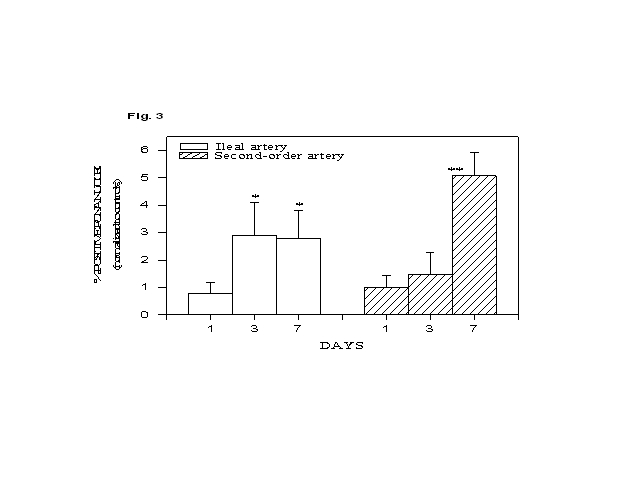
Figure 3 shows the percent PCNA-positive medial SMC nuclei normalized to control values. Significant DNA replication is observed after 3 and 7 days of exposure to elevated flow.
 Click to enlarge
Fig. 3: Immunocytochemical results for medial SMC PCNA in ileal and second-order arteries. Data represent percent PCNA-positive medial SMC nuclei for high flow vessels divided by those for control vessels for both the ileal artery and second-order branch. Data were best represented in this fashion to account for the elevated basal levels of PCNA-positive nuclei, which ranged between 7 and 21%. Data suggest significant DNA synthesis in the media of SMCs after exposure to elevated blood flow for 3 and 7 days. Values represent meanÝSEM, and n = 6 for each group. Between 3 and 5 cross-sections per vessel were analyzed. * p<0.05, ** p<0.01 versus control.
Click to enlarge
Fig. 3: Immunocytochemical results for medial SMC PCNA in ileal and second-order arteries. Data represent percent PCNA-positive medial SMC nuclei for high flow vessels divided by those for control vessels for both the ileal artery and second-order branch. Data were best represented in this fashion to account for the elevated basal levels of PCNA-positive nuclei, which ranged between 7 and 21%. Data suggest significant DNA synthesis in the media of SMCs after exposure to elevated blood flow for 3 and 7 days. Values represent meanÝSEM, and n = 6 for each group. Between 3 and 5 cross-sections per vessel were analyzed. * p<0.05, ** p<0.01 versus control.
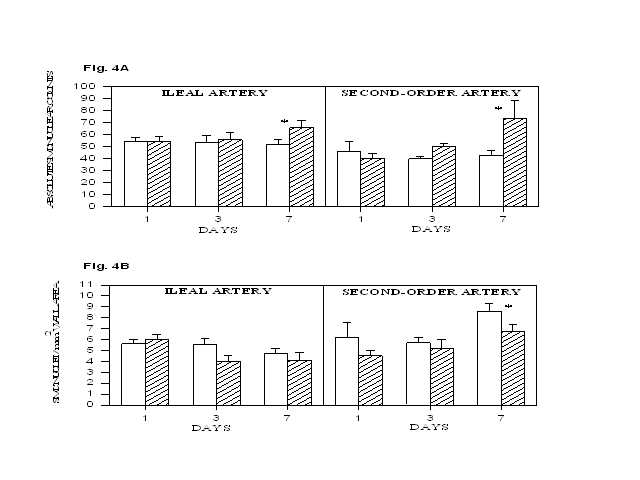
In the case of polyploidy whereby cells undergo DNA synthesis without cell division, PCNA labeling could provide biased results. Figure 4:A illustrates absolute medial SMC nuclei counts, indicating significant cell proliferation in both order vessels after 7 days. When data were normalized to medial wall area (Fig. 4:B), SMC nuclear density remained constant in the presence of enlarged wall areas for almost all time points.
 Click to enlarge
Fig. 4: A: Absolute medial SMC nuclear counts indicate significantly increased cell division after in vivo exposure to flow for 7 days for both ileal and second-order arteries. (B) Normalized medial SMC nuclear counts suggest that, at most time points, increased cell division is proportional to increased medial wall area maintaining a constant SMC density. The second-order vessel demonstrated a significant decrease in cell density upon exposure to elevated flow after 7 days, suggesting that cellular hypertrophy and perhaps nuclear polyploidy may be involved in this vessel at this time point. Alternatively, SMCs in this vessel may be actively engaged in the cell cycle prior to cytokinesis. Values represent meanÝSEM, with n = 6 for each group. Between 3 and 5 cross-sections per vessel were analyzed. * p<0.05 versus control.
Click to enlarge
Fig. 4: A: Absolute medial SMC nuclear counts indicate significantly increased cell division after in vivo exposure to flow for 7 days for both ileal and second-order arteries. (B) Normalized medial SMC nuclear counts suggest that, at most time points, increased cell division is proportional to increased medial wall area maintaining a constant SMC density. The second-order vessel demonstrated a significant decrease in cell density upon exposure to elevated flow after 7 days, suggesting that cellular hypertrophy and perhaps nuclear polyploidy may be involved in this vessel at this time point. Alternatively, SMCs in this vessel may be actively engaged in the cell cycle prior to cytokinesis. Values represent meanÝSEM, with n = 6 for each group. Between 3 and 5 cross-sections per vessel were analyzed. * p<0.05 versus control.
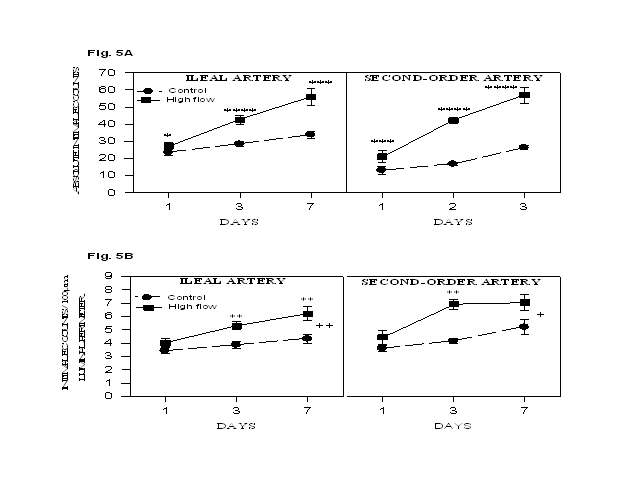
Figure 5 similarly shows absolute (A) and normalized (B) nuclear cell counts for intimal ECs exposed to elevated blood flow for 7 days. All data illustrate highly significant EC replication with flow exposure over the 7 day period.
 Click to enlarge
Fig. 5:A: Absolute intimal EC nuclear counts and (B) intimal EC nuclear counts normalized to 100 çm luminal perimeter. These results indicate that once blood flow is increased, the shear stress stimulus is rapidly sensed by intimal endothelium leading to EC replication after 24 hours continuing through 7 days. Significant interactions were detected between flow and time for normalized EC counts in both ileal and second-order arteries. Values represent meanÝSEM, with n = 10 for the ileal artery group and n = 8 for the second-order branch group. Between 3 and 5 cross-sections per vessel were analyzed. * p<0.05, ** p<0.01, *** p<0.001, **** p<0.0001 versus control; + p<0.05, ++ p<0.01 versus day.
Click to enlarge
Fig. 5:A: Absolute intimal EC nuclear counts and (B) intimal EC nuclear counts normalized to 100 çm luminal perimeter. These results indicate that once blood flow is increased, the shear stress stimulus is rapidly sensed by intimal endothelium leading to EC replication after 24 hours continuing through 7 days. Significant interactions were detected between flow and time for normalized EC counts in both ileal and second-order arteries. Values represent meanÝSEM, with n = 10 for the ileal artery group and n = 8 for the second-order branch group. Between 3 and 5 cross-sections per vessel were analyzed. * p<0.05, ** p<0.01, *** p<0.001, **** p<0.0001 versus control; + p<0.05, ++ p<0.01 versus day.
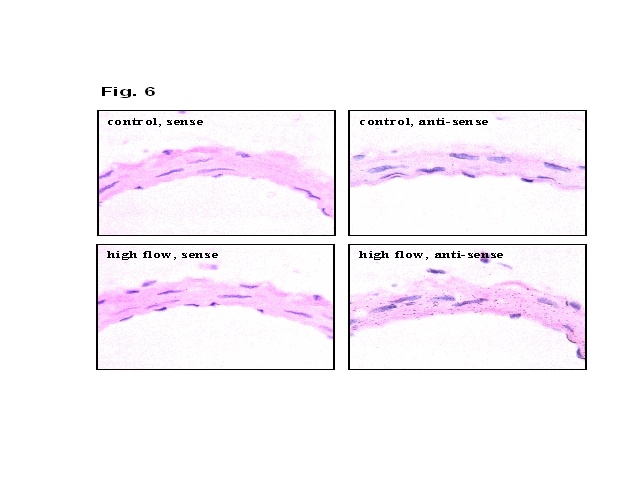
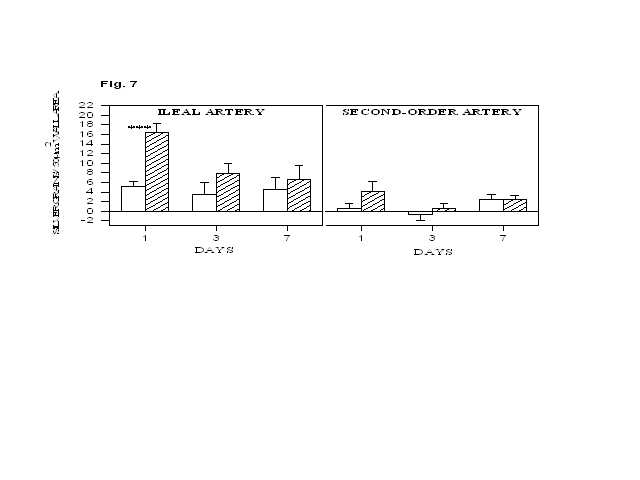
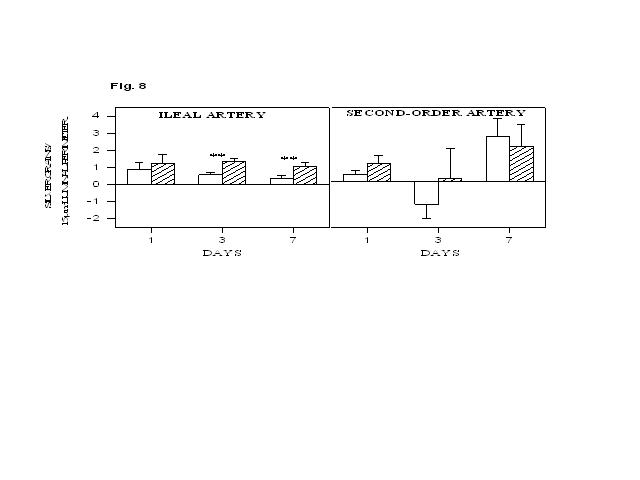
In situ hybridization Figure 6 illustrates examples of silver grain autoradiography for PDGF-A mRNA expression for same animal control and high flow vessels after 24 hours. Increased expression of PDGF-A in the media of the high flow ileal artery is clearly indicated by the abundance of silver grains. Summary data for medial wall SMC PDGF-A mRNA expression are illustrated in Figure 7. A highly significant increase (+215%) in medial PDGF-A mRNA is demonstrated in the high flow ileal artery after 24 hours. This increase becomes non-significant after 3 and 7 days as the values decline towards control levels. Figure 8 shows in situ hybridization summary data for endothelial PDGF-A mRNA expression. The ileal artery demonstrated a non-significant (+39%) increase in EC expression after 24 hours which becomes significant after 3 and 7 days.
 Click to enlarge
Fig. 6: Autoradiographs for PDGF-A mRNA expression for same animal sense and anti-sense control and high flow ileal arteries after 24 hours.
Click to enlarge
Fig. 6: Autoradiographs for PDGF-A mRNA expression for same animal sense and anti-sense control and high flow ileal arteries after 24 hours.
 Click to enlarge
Fig. 7: Medial SMC PDGF-A mRNA expression for control and high flow ileal and second-order branch vessels after in situ hybridization with 35S-CTP riboprobe and development of silver grain emulsion after 10 weeks. PDGF-A mRNA expression is significantly elevated in the ileal artery after 24 hours and then gradually declines towards control levels by 3 and 7 days. Basal levels of PDGF-A mRNA expression are evident in the control ileal artery. No significant differences were detected between control and high- flow second-order arteries, and basal expression in these vessels was low. Values represent meanÝSEM, and n = 9 for the ileal artery group and n = 7 for the second-order artery group. *** p<0.001 versus control.
Click to enlarge
Fig. 7: Medial SMC PDGF-A mRNA expression for control and high flow ileal and second-order branch vessels after in situ hybridization with 35S-CTP riboprobe and development of silver grain emulsion after 10 weeks. PDGF-A mRNA expression is significantly elevated in the ileal artery after 24 hours and then gradually declines towards control levels by 3 and 7 days. Basal levels of PDGF-A mRNA expression are evident in the control ileal artery. No significant differences were detected between control and high- flow second-order arteries, and basal expression in these vessels was low. Values represent meanÝSEM, and n = 9 for the ileal artery group and n = 7 for the second-order artery group. *** p<0.001 versus control.
 Click to enlarge
Fig. 8:. Endothelial PDGF-A mRNA expression for control and high flow ileal and second-order branch vessels after in situ hybridization with 35S-CTP riboprobe and development of silver grain emulsion after 10 weeks. PDGF-A mRNA expression is significantly elevated in the ileal artery endothelium after exposure to high flow for 3 and 7 days. No significant differences were detected between control and high flow second-order arteries at any time. Values represent meanÝSEM, and n = 10 for the ileal artery group and n = 7 for the second-order artery group. ** p<0.01 versus control.
Click to enlarge
Fig. 8:. Endothelial PDGF-A mRNA expression for control and high flow ileal and second-order branch vessels after in situ hybridization with 35S-CTP riboprobe and development of silver grain emulsion after 10 weeks. PDGF-A mRNA expression is significantly elevated in the ileal artery endothelium after exposure to high flow for 3 and 7 days. No significant differences were detected between control and high flow second-order arteries at any time. Values represent meanÝSEM, and n = 10 for the ileal artery group and n = 7 for the second-order artery group. ** p<0.01 versus control.
| <= Materials & Methods | RESULTS | Discussion & Conclussions => |
| Discussion Board | Next Page | Your Symposium |