Poster
Contents
| INABIS '98 Home Page | Your Poster Session | Related Symposia & Posters | Plenary Sessions | Exhibitors' Foyer | Personal Itinerary | New Search |
Introduction
The constant of photographic quality is important in a processing and calculation of a digital image of the eruption. In a fractal analysis of three-dimensional figure of brightness on digital images the preparatory processing is also required to keep the reliability of results. In this study the use of quadratic differential elements and its utilization to get the good results by computer is presented, and these methods are applied for the examination of clinical image of chronic eczema, lichen planus, Bowen's disease and several skin diseases.
Back to the top.
Eight clinical features of each disorder occurred with outpatients in this hospital were digitized by the film scanner (35 mm positive film) and the digital camera. The range of 5 mm x 5 mm on eruption was recorded in 300 pixels x 300 pixels image, and the computer examined the texture of this limited area.
Software : Visual Basic 2, 5 for Win. CPU: Pentium MMX. Scaner: Minolta Quick Scan 35. Digital camera : Nikon Coolpix 900
Materials and Methods
Analysis of image pattern
 The range of 300 pixels x 300 pixels (it is 5mm x 5mm on eruption) was converted into BMP format, and brightness was calculated from RGB value.Å@The formula is as follows; Blue x 0.11 + Green x 0.59 + Red x 0.3.
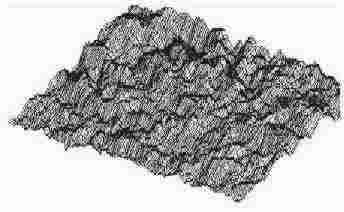
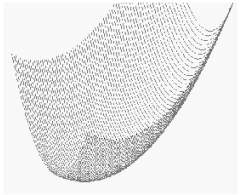
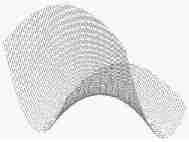
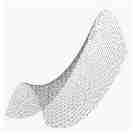
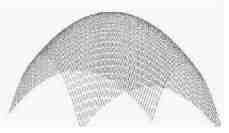
This brightness value P was set as P=f(x,y) for a function of length and breadth x, y coordinate on image. When these value is replaced to the third coordinate, the structure of a valley and mountainous becomes as Figure 1. This structure subtly changes by the light and shade of photography and unevenness of illumination, even if it is the same object, and it means the lack of universality. In order to make up this deficit, seven filters were prepared.
1. Hessian
Hessian consists of quadratic differential element showing the unevenness structure of three dimensions.
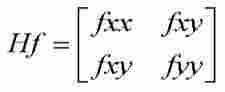
And fxx,fyy,fxy is partial derivative of f(x,y) by x and y. ( 1 )
Theta is the Shape Operator applied of Hessian.
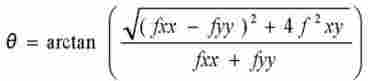
Eigenvector of Hessian is a curvature of a direction along an axis when a curved surface constituted by image f(x,y) is approximated by a quadratic curve. Curved surfaces are classified into four patterns as Dale, Valley, Ridge and Hill by the size of Theta. ( 2 )
 |  |  |  |
 Theta( Shape Operator) is unchangeable to the transformation of concentration shown by the linear equation along x,y coordinate. In this way Theta is hard to be influenced by illumination, and has the potency to show the property of the skin surfaces permanently. The figures were drawn by Theta of Hessian calculated by the interval of 8 pixel after the transformation of the brightness. There are no differences between pictures.
2. Filter to extract a square and a straight line
A black dot on Theta image is set as positive, and a white dot is set as negative. From a positive dot of f(x1,y1) on image, a straight line of 20 pixels is drawn to one direction, and the probability of the existence of positive dots on the drawing line is calculated. This straight line is spun through a full 360 degree around f(x1,y1) as center point. When dots of positive exist more than a certain probability, function p(x1,y1) on the another picture is put as positive, then the new image is made on the another picture.
3. Filter to extract dot
A black dot on Theta image is set as positive, and a white dot is set as negative. From a positive dot of f(x1,y1) on image, a straight line of 20 pixels is drawn to one direction, and the probability of the existence of positive dots on the drawing line is calculated. This straight line is spun through a full 360 degree around f(x1,y1) as a center point. When dots of positive exist less than a certain probability and the probability that positive dots are not next to each other is high, function p(x1,y1) on the another picture is put as positive, then the new image is made on the another picture.
4. Filter to extract curve
>From a positive dot of f(x1,y1) on the image, a curve of 25 pixels is drawn to one direction with a certain curvature, and the probability of the existence of positive dots on the drawing line is calculated. This curve is spun through a full 360-degree around f(x1,y1) as a center point. When dots of positive existed more than a certain probability, function p(x1,y1) on the another picture is put as positive, then the new image is made on the another picture.
5. Coefficient of variation of fractal dimension on divided images
If there is a complete self-resemblance on any part of the image, fractal dimensions on each part on the image are same. In real organism, a subtle difference of fractal dimension occurs by the location. This difference was shown by the coefficient of variation, and the characteristic of the skin image seems to be presented in the value - coefficient of variation.
( 3 )
Coefficient of variation of fractal dimension on divided images = ST / (FA / N)
FA = A11+A12+A13+...+A33+.....+Ann
Amm = fractal dimension of each divided area calculated by the method 1.
N = number of divided parts ( n x n)
ST = standard deviation of Amm
Method 1 ( 3 )( 4 ) ( 5 )
Calculation of fractal dimension by the method of Hausdorff dimension
[ Hausdorff dimension = lim R(s), ( when s convergence to 0). R(s)= - log N(s)/log s, (when Figure F is covered by the unit scale s, N(s) is the number of the required unit scale s). These formulas stand up when F has self- similarity. ]
The unit scale is set up as r, and the unit area element as r x r. When the unit area elements cover the entire three-dimensional surface, N(r) is the number of unit area elements as Hausdorff dimension. Surface area of a screen (A(r)) is r x r x N(r), and fractal dimension is supposed by the ratio of log r and log A(r). [N(r)=A(r)/(r x r), so log N(r)=log A(r) - 2log r. R(r)= - log N(r)/log r = - log A(r)/log r + 2]
Surface area
Surface area is derived from the summation of the unit triangle made by X, Y , Z coordinate of the three-dimensional surface. The length of three sides of triangle is easily calculated from X,Y,Z, and each surface area of triangle is derived from the length of three sides. The total value of surface areas of all triangles is dealt as the approximate value.
Back to the top.
Results
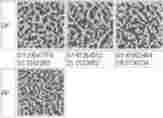
| Theta image | Bowen | Lichen Planus | Eczema |
| Simple fractal dimension | 2.69976 | 2.705539 | 2.77786 |
| Coefficient of variation of fractal dimension | 13.8420001 | 12.79379157 | 11.56413211 |
| Rate through the filter of square and straight line | 18.8 % | 16.4 % | 9.1 % |
| Rate through the filter of dot | 8.7 % | 9.4 % | 13.1 % |
| Rate through the filter of curve | 23.1 % | 23.1 % | 11.8 % |
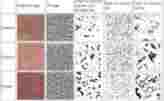
A simple fractal dimension increased in eczema, because there were many dot elements on the image. Big straight-line components were extracted in Lichen Planus. Figures as a whirlpool were extracted in Bowen's disease. The values of table 1 have universal significance, because the normalization was already completed on the figure by Theta(Shape Operator). If the complete self-resemblance is formed, fractal dimension of each range is constant. A subtle difference occurs with a difference of a location in the real organism, and its difference is shown by a coefficient of variation of fractal dimension. Big difference or large coefficient of variation of fractal dimension seems to relate the degree of abnormality of the skin disorder.
Examination of other skin diseases
Standard deviation and a coefficient of variation of a simple fractal dimension was calculated for Theta figures of seborrheic keratosis, actinic keratosis, basal cell carcinoma and squamous cell carcinoma. A large value of coefficient of variation of fractal dimension seemed to show the abnormality of the skin disease. ( A difference was not clear between these diseases in the calculation of a simple fractal dimension)
Relation between Theta figure and histological figure
Other findings
The processing of Theta (Shape Operator) was not effective in the examination of a hyperpigmented lesion and a hyperkeratotic lesion. It was needed to exclude these cases by color tone and a simple fractal dimension beforehand. For example a fractal dimension often exceeds 2.6 in hyperkeratosis. The use of the coefficient of variation derived from fractal dimension of the circumference or the frequency characteristic of the shape within a limited range is recommended in a hyperpigmented lesion and a hyperkeratotic lesion.
Relation between the brightness value and the real shape of the skin surface
-- Making of a real surface figure from a digital picture ---
When a gradient of x, y, z coordinate of three dimensions of the structure of the real eruption is set with [ p, q ] = [dz/dx,dz/dy] and the brightness value of the image is set with I and the reflection function of the eruption surface is set with R, the equation of illumination of image is I(x,y) = R(p,q).(6) A solution of I(x,y) = R(p,q) can be lead by use of dz/ds = p x Rp + q x Rq (ds is a small liner unit). This means that [dp dq] is got by the tracing of [dx dy].( 7 ) This method is equivalent to get Hessian. ( 1 )
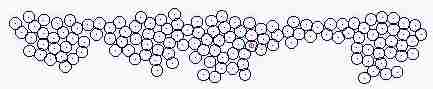
Skin growth in the computer
Back to the top.
Discussion and Conclusion
When dermatologists see an eruption, the vision of eruption may be processed for the understanding and diagnosis. After making new dimensions the information as size, character of a shape, brightness and texture may be converted and thrown into the new dimensions made in the dermatologist's brain. For the computer a processing of texture is easy compared with the another conversion (shape, size). This study presented that the character of texture showed a part of the property of eruption including abnormality, and Theta processing figure by Hessian was a good preprocessing device for the normalization of texture. The relation between the simple fractal dimension and the abnormality were discussed in the several literatures until now. This study showed that a coefficient of variation of fractal dimension after the proper normalization is one of the good markers showing the property of eruption, and there is a possibility that this method can be applied to the another field. The study of the virtual epidermal growth presented that a coefficient of variation of applied mass dimension was connected with the lack of uniformity of cell size. This method may be possible to apply in the histological examination.
References
- Haralick RM (1983), The International Journal of Robotics,2-1:195.
- Sukanya P (1996), Technical Report of IEICE, PRU95-224, 63.
- Yagi E (1997), http://openglobal.med.uoeh-u.ac.jp/4iwc/SESSIONS/POSTERS/PA0125/index.htm.
- Mandelbrot BB,(1982), The fractal geometry of nature, W.H. FREEMAN, New York.
- Yagi E (1997), Japanease Journal of Dermatology 103,13, 1881-1883.
- Horn BKP (1986), Robot Vision, MIT Press.
- Horn BKP (1975), The Psychology of Computer Vision, P H Winston,McGraw-Hil.
| Discussion Board | Previous Page | Your Poster Session |