Invited Symposium: Role of the Basal Forebrain Neurons in Cortical Activation and Behavioural State Regulation
| INABIS '98 Home Page | Your Session | Symposia & Poster Sessions | Plenary Sessions | Exhibitors' Foyer | Personal Itinerary | New Search |
Introduction
Several lines of evidence have implicated the cholinergic magnocellular regions of the basal forebrain (BF) in the regulation of cortical excitability and wakefulness (W). This BF region contains cholinergic and non-cholinergic cortically projecting neurons, of which the majority exhibit their highest discharge activity during wakefulness (wake-active neurons). We recently reported in vivo evidence that this BF region is a potent site for the sleep-inducing action of endogenous adenosine (AD) (Porkka-Heiskanen et al. 1997). Adenosine, a byproduct of cellular metabolism, is an inhibitory neuromodulator and putative sleep factor. In vitro studies from our lab have shown that AD exerts a tonic inhibitory control over the cholinergic neurons of the BF and mesopontine tegmentum (Rainnie et al. 1994). Furthermore, the stimulants caffeine and theophylline are powerful antagonists of AD receptors. Data from recent and ongoing experiments is presented below that addresses the following hypothetical model: During prolonged wakefulness, when neural metabolism is highest, extracellular AD accumulates selectively in the BF and promotes the transition from wakefulness to slow wave sleep (SWS) by inhibiting the wake-active neurons in the BF.
Materials and Methods
Experimental Animals & Surgery.
Subjects (cats) were housed under constant temperature (23 deg C), with ad libitum access to food and water. Under deep surgical anesthesia, animals were stereotaxically implanted with electrodes to record electroencephalogram (EEG), electrooculogram (EOG), electromyogram (EMG) and dorsal lateral geniculate nucleus ponto-geniculate-occipital (PGO) wave activity. Intra cerebral guide cannulas and/or microdrives were implanted above the target sites for later insertion of the microdialysis (MD) probe.
Target Sites, Stereotaxic Coordinates.
Coordinates give the ventral tip of the dialyzing region for each target area. All MD probes had a 2 mm length of dialyzing membrane except for 1 mm used in the DRN. The angle of approach was 90 degrees unless noted. Brainstem coordinates are from the Berman Atlas (1968) and forebrain coordinates from the Berman and Jones Atlas (1982). Target Sites: Basal Forebrain: Substantia Innominata: AP 15.5, ML 5, DV -1.5. Pedunculopontine Tegmental Nucleus (PPT): 45 degree angle; AP +1.0, ML 3.0, DV -2.5. Dorsal Raphe Nucleus (DRN): A 0.6; ML 0; DV -1.5. Preoptic Area of Hypothalamus (POA): AP +14.5, ML 3.0, DV -2.1. POA probes were targeted at the cat homology of the ventrolateral preoptic area, a site shown in rat to contain sleep-active neurons. In the absence of precise histological work to identifying the vlpo in cat we use the more general term POA. Thalamus. The ventroanterior and ventrolateral complex (VA/VL): AP 11, ML 5, DV 2.5. Cerebral Cortex: Cingulate Gyrus: AP +8, ML 1.5, and DV +14.5.
Microdialysis Sampling Procedures.
MD experiments were conducted in a sound-attenuated chamber that had the same temperature and light conditions as the animals' home cages, with food and water available ad libitum. CMA 10 probes (CMA/ Microdialysis; Acton, MA) with polycarbonate membrane (20,000 Dalton cutoff and a 500 µm outer diameter) were used. In vitro recovery data indicate that AD recoveries for 2 mm and 1 mm CMA 10 probes respectively are: 12-18% and 6-10%. Prior to the beginning of the experiment, the MD probe was inserted through the guide cannula into the target site, and the probe secured to the guide cannula. Subjects were connected to an electrical polygraph cable for recording of behavioral state and then to the probe inlet and outlet tubing (1m pieces of low dead volume FEP tubing; CMA/microdialysis). Artificial cerebrospinal fluid (ACSF = NaCl 147 mM, KCl 3 mM, CaCl 1.2 mM, MgCl2 1.0 mM, pH 7.2) was perfused at a flow rate of 1.5 µl/min. Samples were collected from the outlet tubing after exiting the cage. Timing marks were put on the EEG paper record at the time of collection of each sample. Sample volumes were 7.5 to 15 µl/sample allowing a desirably short sampling interval of 5 to 10 minutes (5 min x 1.5 µl/min flow rate = 7.5 µl). For all experiments the time delay due to the dead volume of the system (fluid contained in the output perfusate tubing and the probe) was taken into account in correlating neurochemical readings with the EEG recording of behavioral state. For measuring state-specific correlations with the biochemical measurements, we primarily used those behavioral epochs which consisted of a single behavioral state. All parts of the MD sampling system were washed regularly with 70% ethanol.
Neurochemical Analysis of Adenosine.
AD was analyzed using microbore HPLC systems (BAS 480, Bioanalytical Systems, W. Lafayette, Indiana), with methods based on those previously described (Porkka-Heiskanen et al. , 1997). The AD assay has been found to be linear over the assayed range using a multiple point standard curve. The mobile phase consisted of 8mM NaH2PO4 in 8% methanol, pH=4, with a BAS PM-80 pump producing a flow rate of 80 µl/min through the microbore column. Separation was achieved by a BAS SepStik microbore column (BAS MF-8943) attached directly to the injector (Rheodyne 9125) and the UV detector, set at a wavelength of 258 nm (Waters 486 UV detector). Peak heights of MD samples were compared to the peak heights of an AD standard (1pmol) for quantification. Retention time of AD was approximately 8 min and the assay detection limit was generally less than 50 fmol/injection.
Combined Unit Recording & Microdialysis Methods.
Extracelluar single unit electrophysiology was combined with local drug delivery via an adjacent MD probe, a novel technology that allowed us to determine AD effects on different types of behaviorally characterized BF neurons (also see Thakkar et al., 1998). The unit recording protocol takes unit discharge as the main variable of interest. Our preliminary data indicate, not surprisingly, that units recorded in the vicinity of the MD probe delivering a pharmacological agent respond very quickly to the agent, in contrast to the much slower response time course of sleep-wake states, both in terms of detectable onset latency and the time required to measure changes.
Surgical preparation of animals and implantation of electrodes for electrographic recordings has been described in the previous section. The unit recording proposed in this application is to be done in conjunction with MD perfusion of pharmacological agents. For this purpose we have used concentric microdrives implanted bilaterally in the BF. Each concentric microdrive consisted of a 19 ga MD probe cannula which was inserted in the advanceable 17 ga stainless steel cannula of a screw-driven microdrive with a 14 ga fixed outer cannula. The microwire unit recording bundle of thirteen 32 µm and one 64 µm insulated wires was glued to the outside of the 19 ga MD probe cannula. Within the MD probe cannula was an obturator, which was removed at a later time to allow microdialysis probe insertion. Dimensions of the steel guide cannula were as follows: The 19 ga MD cannula was O.D.= 1.1 mm and I.D. = 0.8 mm. . The advanceable stainless steel tube (17 ga) had dimensions of O.D.= 1.5 mm and I.D. = 1.2 mm. The fixed microdrive cannula had the dimensions (14 ga) of O.D.= 2.1 mm and I.D. = 1.7 mm. This concentric microdrive was constructed so that the electrode tips ended up in the middle (dorso-ventrally) of the 2 mm length of dialysate membrane, and furthermore, we estimate that the electrode tip was approximately 200 microns from the lateral surface of the MD probe.
The guide tube of both the devices was stereotaxically targeted bilaterally above the BF Substantia Innominata. At the time of surgery the drive was fixed to the skull with dental acrylic so that the tip of the guide cannula was 5 mm above the target. A bundle of fourteen insulated flexible Formvar-insulated stainless steel microwires was attached with SuperGlue to the guide cannula so as to protrude 4 mm beyond the cannula and thus reach about 1 mm above the target. Unit recording began after post-operative recovery and adaptation to the testing cage. Microwires were advanced in steps of 40-80 µm until resolvable single units were encountered, and then the MD probe was placed in the dialysis cannula. At least 12 hours after probe insertion, perfusion with ACSF was begun, and baseline spontaneous unit activity during active waking (AW), quiet waking (QW), and slow wave sleep (SWS) of resolvable units was recorded. Then the pharmacological agent to be tested was perfused through the MD cannula, and unit activity and electrographic data were recorded.
Signal Processing of Unit Activity.
The 14 unit signals were led through a switching device and then any two channels went first to a head-stage amplifier, and then through BAK recording equipment for further amplification, window discrimination, and pulse generation for each resolved spike (3:1 signal:noise). Single unit discrimination was carefully monitored on two Tektronix oscilloscopes. Unit pulse (and divided-by-10 pulses) were recorded on a Grass Polygraph with the other electrographic data. High resolution recording (25kHz digitization for 2 units, 50 for 1) was on a Vetter Digital PCM interface to a Sony VCR, together with 4 electrographic signals. Further analysis on- or off-line is through a pentium computer using a Datawave A/D board & Experimental Workbench and Common Processing software (5.01).
Analysis of single unit activity across behavioral states.
The discharge rates of the neurons were classified into five different states: a) Active Wake (AW), b) Quiet Wake (QW), c) and Slow Wave Sleep (SWS). AW was defined by the presence of an activated (desynchronized) EEG with somatic movement (reflected by EMG artifact) and marked eye movements. QW was the state with an activated (desynchronized) EEG, EMG tonic activity, but no somatic movement and few or no eye movements. The onset of SWS was defined by EEG synchronization without any transient periods of desynchronization. Each cell was recorded for at least one complete cycle of W and sleep. The firing rates were calculated for different behavioral states using at least six epochs of 10 second duration for each state. Wake-active neurons were defined as those neurons in which the ratio of the discharge rate during SWS as compared to AW was at least 0.5.
Histology.
In general, the accuracy of stereotaxic placements in all experiments is confirmed histologically at the conclusion of the experiments. However, in this preliminary report, complete histological data were not available for all sites in all experiments. Animals were perfused transcardially with saline and formalin, the brains removed, post-fixed, and cut in 40 µM sections for both nissl stain, and immunochemical staining using antibodies against neurotransmitter-specific markers, such as choline acetyltransferase (ChAT) and tryptophan hydroxylase.
Results
Measurement of extracellular AD in cat.
We have recently shown evidence in cat that the increasing BF levels of the neuromodulator AD, associated with prolonged periods of W, promotes the transition from W to sleep (Porkka-Heiskanen et al. 1997). As a next step, we began studies to further explore the site specificity of AD's sleep-inducing action by measuring AD levels in several brain sites (BF, VA/VL, PPT, DRN, Cingulate Cortex, POA) during spontaneous sleep cycles, prolonged W & recovery sleep.
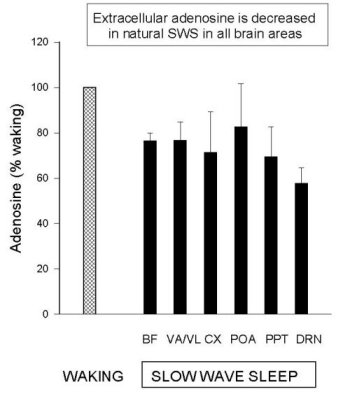
AD levels during Spontaneous Sleep Cycles.
Figure 1 shows that Mean (±SEM) AD levels in samples collected during spontaneous W were significantly higher than during periods of consolidated SWS for all structures studied to date (except POA). Values are normalized to the basal W values (100%) for each structure. Note that the different brain regions had approximately the same reduced level in SWS, which was approximately < 75% of W values. The differences were significant for all areas (t-tests, p<0.05), except the POA (N= 4) (Data examples: absolute BF values (mean±SEM): N=6, W = 41.4 ± 5.7 nmol/l; S = 32.6 ± 5.4 nmol/l; DRN values: N=5, W = 21.5 ± 4.1 and SWS 8.5 ± 1.4 pmol/l; lower values due to smaller probe tip). It should be emphasized that during brief periods of SWS, AD levels do not decline as much as during periods of consolidated sleep (e.g., see fig 1B in Porkka-Heiskanen et al. 1997).
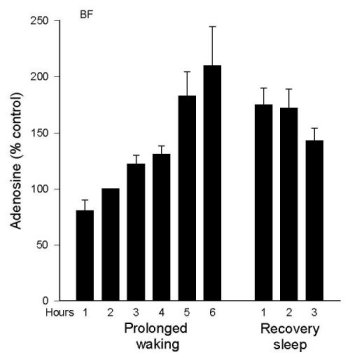
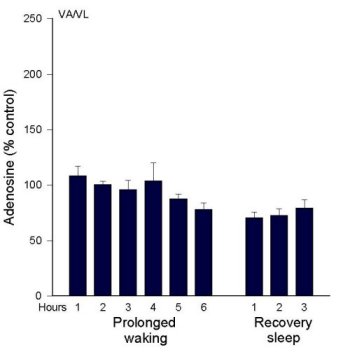
AD levels during Prolonged Wakefulness. As we reported in 1997 (Porkka-Heiskanen et al. 1997), AD levels rise in the feline BF during 6 hours of sleep deprivation (Figure 2a). During the recovery period, after deprivation ended, BF AD levels gradually decreased over the next 2-3 hours, a time when the behavioral state was mainly SWS. Next, we were somewhat surprised to not find a similar rise in the VA/VL during 6 h sleep deprivation (Figure 2b). This led us to add several more brain regions to be tested. Preliminary data exist measuring AD concentrations in 6 different brain regions during 6 hr total sleep deprivation produced by gentle handling/playing (EEG verified), and during the post-deprivation recovery sleep period (3 h) (AD levels are expressed as a % of the AD level measured in a baseline W sample). The clearest pattern emerged in the BF, where AD levels rose throughout the period of prolonged W and then declined in recovery sleep (see details in Porkka-Heiskanen et al. 1997). Although less steep, the rise in AD levels in the cortex site appeared similar to the BF (currently, N=4). However, in the thalamus (VA/VL), DRN, PPT, and POA, AD levels did not rise during 6 h sleep deprivation.
In summary, during spontaneous sleep-wake cycles in cat, AD levels fluctuated similarly in the brain areas tested. During prolonged W, AD levels steadily increased in the BF; a similar pattern, although less pronounced, was seen in cortex. However, a rise with prolonged W was not seen in other areas, suggesting that during prolonged waking AD levels may not be similarly elevated in all brain areas, as would be expected if AD were a sleep-inducing factor linked to metabolism that was acting globally. Many factors determine the level of extracellular AD, and it is beyond the scope of the present paper to fully explain the variations observed. Nonetheless, these data, taken together with our behavioral data on local perfusion with AD transport inhibitors (described below), suggest that AD is a physiological sleep factor and support the hypothesis that high brain levels of AD promote drowsiness and the transition from W to sleep by acting on the cholinergic zone of BF.
BF drug perfusions and sleep behavior in cat.
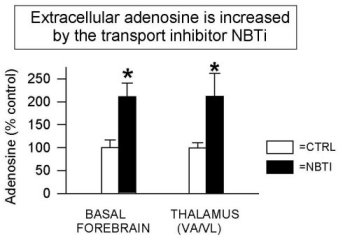
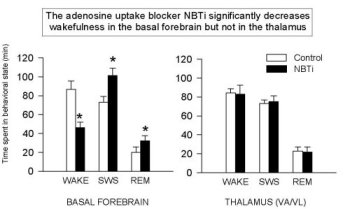
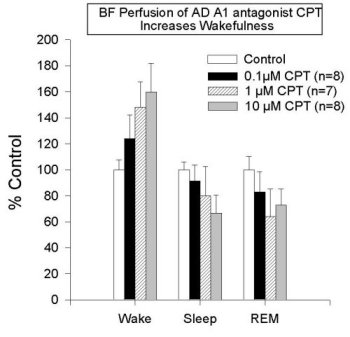
Figure 3 shows that the addition of NBTI (1 µM, an AD transport inhibitor) increases extracellular AD levels two-fold in all areas studied to date (also see Porkka-Heiskanen et al., 1997; BF & VA/VL shown here, DRN & cortex data are not shown). As reported (Porkka-Heiskanen et al., 1997), the behavioral effects of NBTI-induced AD increases in BF and thalamus indicate an especially powerful effect of AD in the BF cholinergic zone. Cholinergic neurons have widespread and strategic efferent targets in the thalamic and cortical systems important for the control of EEG arousal. As shown in Figure 4, there was a significant decrease in W and an increase in SWS & REM sleep when 1 µM NBTI was (unilaterally) perfused in the BF, but not when perfused in thalamus (see Porkka-Heiskanen et al. 1997, for statistical details), despite both treatments' yielding increased local AD concentrations (the Y-axis plots the time in minutes spent in each state during the 3 h control & drug periods). NBTI perfusion produced no significant sleep-wake changes in thalamus, consistent with a differential effect on behavioral state in the BF cholinergic zone, as contrasted with the non-cholinergic thalamus. Furthermore, in preliminary experiments, BF perfusion of A1 antagonist (CPT) increased W (Figure 5; paired t (4)=6.2, p<.005) and decreased sleep, effects opposite of BF perfusion with AD agonists (NBTI or AD itself), and suggesting that the A1 receptor may mediate the NBTI & AD (300uM) effects already seen. In Figure 5, the drug-induced change in time spent in each of 3 behavioral states (W, SWS, REM; 3 h period) is expressed as the % of the 3 h period of control sleep that preceded the drug perfusion.
 Replace with your figure caption.
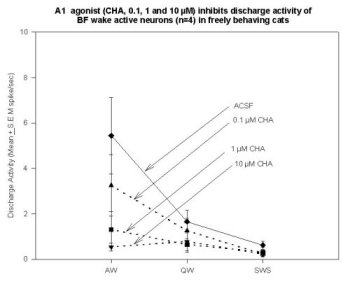
Unit Recording Combined with MD in the Basal Forebrain. Data support the hypothesis that W-selective cells in the BF (possibly cholinergic EEG activating neurons) are inhibited by AD agonists. Cyclohexyladenosine (CHA, an A1 agonist; 0.1, 1.0, 10.0 µM) has produced a dose-dependent decrease in the neuronal discharge in the 4 neurons recorded to date. Figure 6 shows the A1 agonist-induced inhibition of discharge in 4 neurons, relative to their discharge rate during the preceding ACSF perfusion period.
Discussion and Conclusion
The powerful behavioral state-altering effects of AD could hypothetically occur primarily via the cholinergic neurons' widespread and strategic efferent targets in the cortical and thalamic systems that are known to be important for the control of cortical activation. Our recent preliminary data in cat strengthen the hypothesis that the BF region mediates the sleep-promoting actions of endogenous AD following prolonged wakefulness.
Thus, we find that during 6 h of prolonged wakefulness AD levels rise sharply in the cholinergic zone of BF, but not in any other subcortical structures tested to date. This site-specific accumulation of AD during prolonged wakefulness suggests that the sleep-promoting effects of AD may be mediated by an AD inhibition of the BF cholinergic arousal system. The marked regional variations in AD levels observed indicate further the existence of precise physiological regulation of AD levels, by, as yet, unidentified mechanisms. Finally, using the novel method that combines single unit recording and MD, we now show at the level of the single neuron that AD agonists inhibit the discharge activity of wake-selective BF neurons. Taken together these data support the hypothesis that AD and antagonists at AD receptors alter behavioral state via their actions in the cholinergic zone of the BF. It remains important to determine if AD's ability to reduce the discharge of BF cholinergic neurons is by itself necessary and sufficient for AD to induce sleep, or whether AD also acts on non-cholinergic arousal-related neurons in the BF.
References
Berman AL (1968) The brainstem of the Cat. Madison, WI: The University of Wisconsin Press.
Berman AL, Jones EG (1982) The thalamus and basal telencephalon of the Cat. Madison, WI: The University of Wisconsin Press.
Porkka-Heiskanen, T, Strecker, RE, Thakkar, M, Bjorkum, AA, Greene, RW and McCarley, RW. Adenosine: A mediator of the sleep-inducing effects of prolonged wakefulness, Science 1997; 276:1265-1268.
Rainnie DG, Grunze HCR, McCarley RW, Greene RW. Adenosine Inhibits Mesopontine Cholinergic Neurons: Implications for EEG Arousal. Science 1994; 263:689-692.
Thakkar, M, Strecker, RE and McCarley, RW. Behavioral state control through differential serotonergic inhibition in the mesopontine cholinergic nuclei: A simultaneous unit recording and microdialysis study, J. Neurosci. 1998; 18:5490-5497.
| Discussion Board | Previous Page | Your Symposium |