Oxidative Stress Poster Session
| INABIS '98 Home Page | Your Session | Symposia & Poster Sessions | Plenary Sessions | Exhibitors' Foyer | Personal Itinerary | New Search |
Results
Purification of GSTs
Hydroxylapatite chromatography separated two forms of GST from the supernatant of frog liver. The two peaks of activity eluted at approximately 125 and 200 mM potassium phosphate and were termed "GST A" and "GST B" respectively. Peak fractions were pooled separately and purification was continued for each pooled peak of activity. GST activity in frog muscle eluted as one minor peak (less than 10% of total activity), at 100 mM potassium phosphate, and one major peak at 160 mM potassium phosphate. Purification was continued only on the major peak.
GST from supernatant of liver of awake S. couchii eluted as one peak off hydroxylapatite, at 175 mM potassium phosphate. The enzyme from liver of estivated animals also eluted as one peak, at 125 mM potassium phosphate. GST from leg muscle of awake and estivated toads eluted in an identical manner, in one peak at 100 mM potassium phosphate.
Typical results obtained for each purification are shown in Tables 1 and 2. Note that U/mg refers to specific activity of GST with CDNB, -fold refers to -fold purification of the enzyme, and %Y is an abbreviation for percent yield.
Table 1: Purification of GST from Liver and Muscle of Awake and Estivated Spadefoot Toad, Scaphiopus couchii.
GST                Awake                 Estivated
                   Liver                 Liver
---------------------------------------------------------
                 U/mg  -fold  %Y       U/mg  -fold  %Y
Supernatant      2.3     1    100      1.3     1    100
OH-Ap            35.6    15   63       6.8     5     52
SH-GSH           81.1    35   36       66.1    50    23


GST                Awake                 Estivated
                   Muscle                Muscle
-----------------------------------------------------------
                 U/mg  -fold  %Y       U/mg  -fold   %Y
Supernatant      0.3     1    100      0.13     1    100
OH-Ap            1.0     3     49      0.3      2     68
SH-GSH           9.8     33    50      9.0      69    60
The maximal activity of GST in the supernatant of liver and muscle of spadefoot toads was reduced substantially in tissues of estivated animals to 56% and 43%, respectively, of the corresponding activity in tissues of awake toads. The purified enzyme from liver of estivated toads had lower specific activity than that from liver of awake toads. By contrast, the specific activity of the purified enzyme from muscle of awake toads was approximately equivalent to that of estivated toads. Purified GSTs from liver generally had higher specific activity than GSTs from muscle.
Table 2: Purification of GST from Liver and Muscle of Leopard Frog, Rana pipiens.
GST                Liver                 Liver
                   Peak A                Peak B
--------------------------------------------------------
                 U/mg  -fold  %Y       U/mg  -fold  %Y
Supernatant      1.0     1    100      Same as peak A
OH-Ap            1.7     1.6   14      4.0     3.6   23
SH-GSH           31.5    30     6      51.3    48    12


GST                Leg
                   Muscle
-----------------------------------
                 U/mg  -fold  %Y
Supernatant      0.07    1    100
OH-Ap            0.8     11    75
SH-GSH           8.1     117   56
The two peaks of GST activity (A and B) had different specific activity. Percent yield was expressed as percent of starting material, so enzyme yields were low since the sample was split. Similar to toad GSTs, liver enzymes showed higher activity than muscle enzymes.
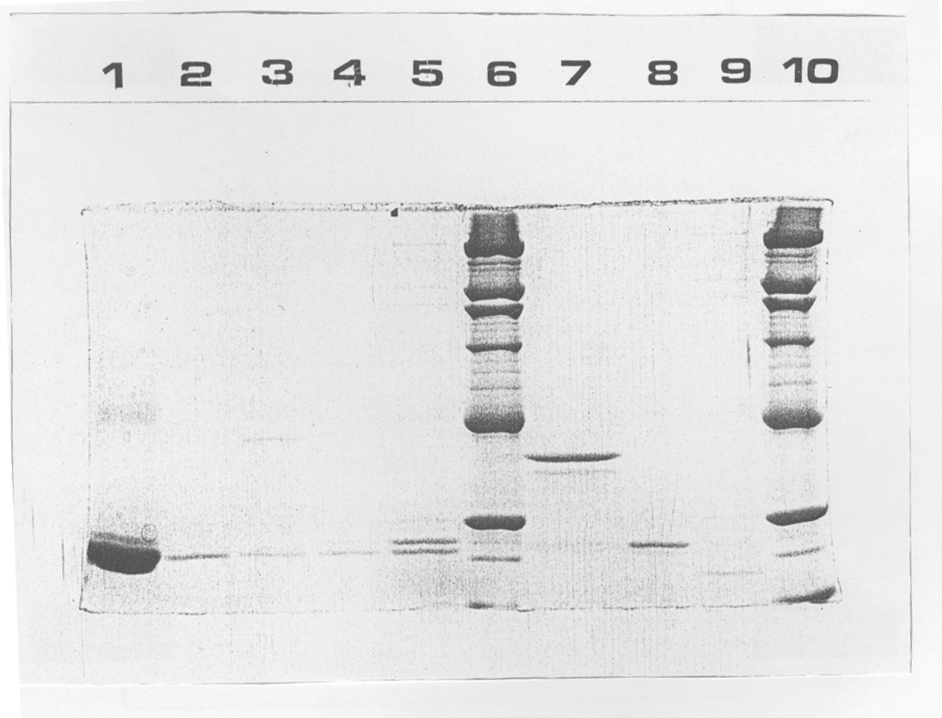
Analysis of purified GSTs by sodium dodecylsulfate polyacrylamide gel electrophoresis (SDS-PAGE) on 12 % acrylamide gels is shown in Figure 1.
 click to enlarge
Fig 1: Purified GST isozymes from liver and muscle of S. couchii and R. pipiens. The gel contained 12 % w/v acrylamide (30:0.8 acrylamide: bisacrylamide) and was stained with silver. Lanes were as follows:
click to enlarge
Fig 1: Purified GST isozymes from liver and muscle of S. couchii and R. pipiens. The gel contained 12 % w/v acrylamide (30:0.8 acrylamide: bisacrylamide) and was stained with silver. Lanes were as follows:
- Horse liver (Sigma).
- Leg muscle of estivated toads.
- Leg muscle of awake toads.
- Liver of estivated toads.
- Liver of awake toads.
- Molecular weight markers (Sigma)
- Frog leg muscle.
- Frog liver GST B.
- Frog liver GST A.
- Molecular weight markers (Sigma)
From top to bottom, molecular weight markers were (kDa): 180, 116, 97.4, 66, 48.5, 29, 18.4 (faint) and part of 14.2.
Subunit molecular weights for purified GSTs were all between 17 and 22 kDa, except for GST from frog muscle, which showed a presumably undissociated species at 38.5 kDa; results were the same for a subsequent purification. Toad muscle GST and frog liver GST B showed one major subunit; indicating the purified protein was likely a homodimer, whereas toad liver GSTs and frog liver GST A showed two species of different molecular weight, indicating a heterodimer or a mixture of heterodimers and homodimers.
Kinetic Analysis of GST from Frog and Toad Liver and Muscle
Table 3: Kinetic Parameters of GST Isolated from Scaphiopus couchii Liver and Leg Muscle
               Awake Liver    Estivated Liver   Leg Muscle (pool)
----------------------------------------------------------------
Km GSH (mM)     0.92 +/- 0.03   0.51 +/- 0.05*   0.25 +/- 0.03*
Km CDNB (mM)    0.51 +/- 0.11   0.78 +/- 0.07*   0.77 +/- 0.08*
I-50 GSSG (mM)  1.05 +/- 0.11   0.200 +/- 0.001* 1.26 +/- 0.29
I-50 Urea (M)   0.85 +/- 0.06   1.57 +/-0.16*    4.22 +/- 0.02*
I-50 KCl (M)    0.23 +/- 0.03   0.49 +/-0.06*    0.08 +/- 0.01*
I-50 NaCl (M)   0.36 +/- 0.04   0.17 +/-0.01*    0.41 +/- 0.02
I-50 NH4Cl (M)  0.19 +/- 0.01   0.15 +/-0.03     0.073 +/- 0.005*
* = significantly different at P < 0.01 from the corresponding value for liver GST from awake S. couchii by the Student's t-test, 2-tailed. GSH concentration was sub-optimal for determination of I-50, at 1 mM for frog liver GST B and GST from liver of awake toads; and 0.5 mM for all other tissues. Note: Kinetic parameters of GST from leg muscle of estivated and awake toads were not significantly different, and purified toad muscle GSTs were accordingly pooled.
Peroxidase activity in final preparations of GST from toad liver was 0.24 U/mg (awake) and 0.39 U/mg (estivated). Peroxidase activity was undetectable in purified toad muscle GST.
Table 4: Kinetic Parameters of GST Isolated from Rana pipiens Liver and Leg Muscle
                 Liver GST A    Liver GST B      Leg Muscle
----------------------------------------------------------------
Km GSH (mM)     0.70 +/- 0.06   0.41 +/- 0.05*   0.39 +/- 0.04*
Km CDNB (mM)    0.41 +/- 0.08   0.72 +/- 0.06*   0.71 +/- 0.05*
I-50 GSSG (mM)  > 10 mM         1.00 +/- 0.05*    1.7 +/- 0.1*
I-50 Urea (M)   1.05 +/- 0.03   2.04 +/-0.04*    1.61 +/- 0.06*
I-50 KCl (M)    0.16 +/- 0.01   0.11 +/-0.02     0.15 +/- 0.01
I-50 NH4Cl (M)   134 +/- 6      82.5 +/-4.1*             ND
* = significantly different from the value for R. pipiens GST peak A by the Student's t-test (2-tailed) P < 0.01. ND = Not Determined.
Peroxidase activity in purified frog liver GST A was 3.9 U/mg, and was undetectable in frog liver GST B and frog muscle GST.
Table 5: Activation Energies (kJ/mol) of GST from Toad and Frog Liver and Muscle.
GST                         Ea (kJ/mole)
------------------------------------------
Awake Toad Liver            55.2 +/- 5.7(a)
Estivated Toad Liver        53.7 +/- 0.6(a)
Toad Leg Muscle             67.1 +/- 1.8(b)
Frog Liver Peak A           37.2 +/- 1.1(c)
Frog Liver Peak B           48.7 +/- 2.9(a)
Frog Leg Muscle             71.1 +/- 0.1(b)
Arrhenius plots of GST activity with respect to temperature were linear over the temperature range of 2 to 40 ° C (2 to 25 ° C for frog muscle). Activity was measured at Vmax concentrations of substrates (GSH and CDNB). Results are means ± S.E.M. of three (estivated toad liver, toad muscle, frog muscle) or four (frog liver peak A, frog liver peak B, awake toad liver) separate determinations. Statistical differences between the means were tested using one-way analysis of variance followed by the Student-Neuman-Keuls Test; values sharing the same letter designation (a, b or c) are not different from each other whereas those with different letter designations are statistically different from each other, P < 0.05.
Activation energies for GST from toad liver and frog liver GST B were not significantly different from one another. Similarly, Ea of GSTs isolated from leg muscle of toads and frogs were not significantly different.
Table 6: Classification of Purified GSTs from Frog and Toad Liver and Muscle Based on Inhibition Values with Specific Inhibitors.
GST                Cibacron Blue   Rose Bengal    S-Hexyl GSH
                        (nM)           (uM)            (uM)
---------------------------------------------------------------
Alpha (human)(a)         5(uM)            1               3
Mu    (human)(a)           50             1               10
Pi    (human)(a)          500            15               20
Toad Liver
   awake             41 +/- 3    0.064 +/- 0.006    12.7 +/- 1.4
   estivated         25 +/- 2**   0.18 +/- 0.02**   17.3 +/- 1.3
Toad Leg Muscle       9 +/- 1**   0.66 +/- 0.02**   12.2 +/- 0.6
Frog Liver GST A    3 +/- 0.5(uM)  1.0 +/- 0.2     11.9 +/- 0.4
Frog Liver GST B     34 +/- 6*    1.22 +/- 0.06     11.1 +/- 0.4
Frog Leg Muscle      35 +/- 4*    0.97 +/- 0.16     11.6 +/- 1.5
Embryonic
   B. bufo GST(b)          0.1          150              14
Adult B. bufo GST(b)       0.25          15             0.05
Results are mean ± S.E.M. of three or four determinations. Data for inhibition of human Alpha, Mu and Pi Class GSTs was from Tahir et al. (1985)(a). Data for adult Bufo bufo liver GST-7.64 and embryonic B. bufo GST was from Aceto et al., (1993) (b).
* = significantly different from corresponding I-50 for frog liver GST A.
** = significantly different from corresponding I-50 for awake toad liver. Significance was assessed using the Student's t-test, 2-tailed, P < 0.05.
Note that values of I-50 for cibacron blue are in micromoles/L for Alpha class GST and for frog liver GST A.
All GSTs isolated from frog and toad muscle and liver showed inhibition characteristics similar to the Mu class of human GST isozymes, except for frog GST A, which had a higher I-50 for Cibacron Blue, similar to Alpha class. However, frog GST A had an I-50 for s-hexylglutathione which was similar to Mu class.
Isoelectric point of GSTs from liver of awake toads was 7.12 ± 0.04 (n=3) and 6.76 ± 0.07 (n=4) from liver of estivated toads, showing a significant difference (P < 0.025). Both isoelectric points are similar to the Mu class of GST isozymes (near-neutral).
| <= Materials & Methods | RESULTS | Discussion & Conclussions => |
| Discussion Board | Next Page | Your Poster Session |