Invited Symposium: Signal Transduction in Endothelium: Mechano-Sensing, Ion Channels and Intracellular Calcium
| INABIS '98 Home Page | Your Session | Symposia & Poster Sessions | Plenary Sessions | Exhibitors' Foyer | Personal Itinerary | New Search |
Introduction
Cardiac endothelial cells share common features as modulators of cardiac performance, rhythm and growth, but it has been suggested that they differ in the way and extent by which they perceive and transmit signals to the cardiomyocytes (Brutsaert, Fransen, Andries, De Keulenaer & Sys, 1998). Of all cardiac endothelial cells, myocardial capillary and endocardial endothelial cells are in closest contact with cardiomyocytes. Myoendothelial junctions with cardiomyocytes, as observed in the larger heart blood vessels with smooth muscle cells (Rubanyi, 1991; von der Weid & Beny, 1993; Beny & Pacicca, 1994; Beny, Zhu & Haefliger, 1997), have, however, not been found (Andries, 1994). Although both endothelial cell types modulate cardiac performance (Brutsaert, Meulemans, Sipido & Sys, 1988; Li, Rouleau, Andries & Brutsaert, 1993), transmission electron microscopy and immunostaining of several connexins (Cx43, Cx40, Cx37) revealed numerous gap junctions between endocardial endothelial cells, but none between myocapillary endothelial cells (Andries, 1994, Brutsaert et al, 1998). This suggests rapid intercellular signalling between endocardial endothelial cells over a large surface area, even following activation of only a single endothelial cell; by contrast regulation of cardiac performance by the myocapillary endothelium would be more localised (Brutsaert et al., 1998).
Cell communication in the endothelium can occur through different pathways, i.e. either through gap junctional coupling (Drumheller & Hubbell, 1997) or through chemical stimuli released from activated cells (Sammak, Hinman, Tran, Sjaastad & Machen, 1997). The different connexins (Cx43, Cx40, Cx37) present in endocardial endothelial cells (Andries, 1994, Brutsaert et al., 1998) have been described to display selective dye and ionic permeability (Veenstra, Wang, Beyer, Ramanan & Brink,1994; Veenstra, Wang, Beyer, & Brink, 1994). It is, therefore, expected that gap junctional coupling between endocardial endothelial cells and, hence, communication between the cells via intracellular messengers might also be selective. In the present study, a new technique is presented by which electrical and dye coupling between endothelial cells can be simultaneously studied. By combining fluorescent tracers with similar molecular weight, but different charge and measuring simultaneously capacitive and ionic currents in whole-cell voltage clamped cultured endocardial endothelial cells from porcine right ventricle, electrical and dye coupling between endocardial endothelial cells was investigated.
Materials and Methods
1) Cell culture: Endocardial endothelial cells from the right ventricle of the porcine heart were isolated, cultured and identified as previously described (Fransen, Demolder & Brutsaert, 1995). The monolayer of endocardial endothelial cells, at about 75% confluence, was trypsinized (EDTA-trypsin, 2.5%). Samples were seeded on glass coverslips (diameter 32 mm) and kept in complete medium for one, two or three days. The first day, mainly single cells and cell pairs were found, while the second and third day small (3-10 cells) to larger (>10 cells) cell clusters were present. At the start of an experiment, the culture medium was replaced by HEPES-buffered saline solution (physiological salt solution, PSS) of the following composition in mmol/l: 5.4 KCl, 141 NaCl, 1.8 CaCl2, 0.8 MgCl2, 10 HEPES, 10 glucose, pH = 7.4 at room temperature. The coverslips were then mounted on the stage of a NIKON-TMD inverted microscope and the cells were superfused with PSS at constant flow of the bathing solution (10 ml/min). Electrophysiological and microfluorometric measurements were then performed.
2) Electrophysiological recordings. Pipettes were pulled from borosilicate glass capillaries (Clark Electromedical Instruments, England) and had resistances between 2 and 5 Mohm when filled with standard pipette solution, containing (in mmol/l) 40 KCl, 70 K-aspartate, 1 CaCl2, 5 MgCl2, 10 HEPES, 10 EGTA, pH = 7.2 at room temperature. Total osmolality of pipette and bathing solutions was 300-310 mOsm/kg H20 (Fiske one-ten osmometer, Fiske Ass., USA). The indifferent bathing electrode was an Ag-AgCl wire connected to the bath via a 100 mmol/l NaCl-agar bridge. Electrophysiological recordings (conventional whole-cell mode) were made by means of an EPC9-amplifier, equipped with data acquisition and analysis software: Pulse and Pulsefit (HEKA Elektronik, Lambrecht/Pfalz, Germany). Compensation for fast capacitive currents was obtained using EPC9-software (Pulse). For single cells or following inhibition of cell-to-cell coupling with heptanol or octanol EPC9-Pulse software also compensated for the slow capacitive component (cell capacity) (+/- 5 mV steps of 20 ms). Capacitive currents of small or larger cell clusters were measured at the return from voltage steps between -140 and +60 mV to the holding voltage, which was usually -60 mV. Total displaced charge during the capacitive transients was measured (EPC9-Pulsefit software) and the slope of the charge-voltage (Q-V) relation determined the total cell cluster capacity. In whole-cell conditions, the series resistance (Rseries) was in general less than 15 Mohm. Steady-state current-voltage (I-V) relations, shown in the present study were obtained by measuring steady-state current amplitudes at the end of 250 ms clamp steps from a holding potential of -60 mV to voltages between -140 and + 60 mV or by ramp clamps of 100 or 200 mV/s between -140 and +60 mV. Whole-cell currents, including the slow capacitive transients, were sampled at 5 kHz, filtered at 1.667 kHz (analog 4-pole Bessel filter) and stored on hard disk.
3) Microfluorometric recordings. All electrophysiological recordings were combined with microfluorometric measurements. Therefore, polar, membrane-impermeant fluorescent tracers with similar molecular weight but different charge were added to the standard pipette solution at concentrations between 5 and 500 µmol/l, prepared from 1 to 5 mmol/l stock pipette solutions. Table 1 summarises the most important characteristics of the tracers. Diffusion of the dye into the cell and to neighbouring cells under whole-cell voltage clamp was followed as a function of time by measurement of emission light intensity as counts per second (cps) on a microscope photometer.
In control experiments with no cells on the coverslips, excitation scans of the individual dyes and different combinations were made to determine the excitation wavelength and relative concentrations of the combined dyes, which gave rise to optimal emission and no or minor interference between combined dyes. Excitation scans were delivered in 1 nm steps between 300 nm and 600 nm (DeltaRAM Multiwavelength Illuminator, Photon Technology International, PTI, USA) and analysed with Felix software (PTI, USA) on a Dell Pentium computer workstation. Emission (dichroic mirror, emission filter PO#128579, WO#A019493, OMEGA OPTICAL, Inc, USA) was measured on a microscope photometer (D-104, PTI, USA). In similar experiments, we tested for diffusion of dye from the pipette in a stable and flowing solution and for the influence of injection of positive or negative current or pressure via the pipette. None of these experimental conditions had a significant influence on the leakage of the dyes from the pipette as compared to real experimental conditions, in which a single cell or cluster of cells was under whole-cell voltage clamp.
Table 1: Characteristics of the polar tracers
   Dye    Molecular weight    charge         Absorption (nm)
                (MW)                          excitation scan
  -----------------------------------------------------------
   CB         645              3-               400
   CA         623             6-/2+             478
   SR         607              +/-              586
Before starting an experiment and attaining the whole-cell mode, horizontal and vertical aperture of the microscope photometer was set around the cells of interest and the timers of both microfluorometric and electrophysiological measurements were set to zero. In single-dye experiments, the cells of interest were continuously excited while emission was measured following integration for a period between 0.5 and 2 s. When multiple dyes were used (maximally 3 in combination), the cells were consecutively excited with the different wavelengths during the integration (illumination) period. During the course of the experiment all experimental interventions were marked and at regular intervals ionic and capacitive currents and the pipette series resistance were measured. Analysis of the cps-time figures was performed off-line using specific software (SPSS, version 8.0)
Results
Endocardial endothelial cell communication was studied by including a combination of three dyes (20 µM CB, 2 µM CA and 20 µM SR) in the pipette solution and whole-cell voltage clamping a single cell or a cell cluster. Dye diffusion was followed and at regular times during the experiment the step voltage clamp protocol was applied to measure capacitive and ionic currents.
 Click to enlarge
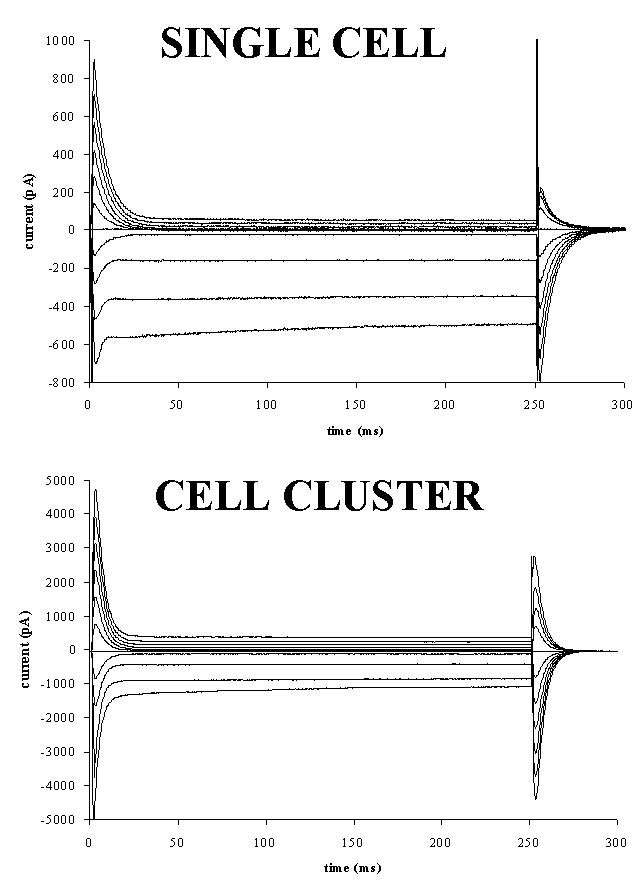
Fig. 1: Capacitive and membrane currents in a single cell (top) and cell cluster (about 6 cells, bottom). Cells were whole-cell voltage clamped at -60 mV and 250 ms voltage steps between -140 and +60 mV were applied. Currents were plotted as a function of time.
Click to enlarge
Fig. 1: Capacitive and membrane currents in a single cell (top) and cell cluster (about 6 cells, bottom). Cells were whole-cell voltage clamped at -60 mV and 250 ms voltage steps between -140 and +60 mV were applied. Currents were plotted as a function of time.
1) Electrophysiological recordings: Figure 1 shows capacitive and membrane currents for a single endocardial endothelial cell (top) and cell cluster (bottom) which was clamped from a holding potential of -60 mV to voltages between -140 and +60 mV. At the start of the voltage steps and upon return to the holding potential capacitive currents on top of membrane currents were measured. Steady-state membrane currents were measured at the end of the 250 ms voltage steps, while displaced charge was determined at the return from the test voltage to the holding potential.
 Click to enlarge
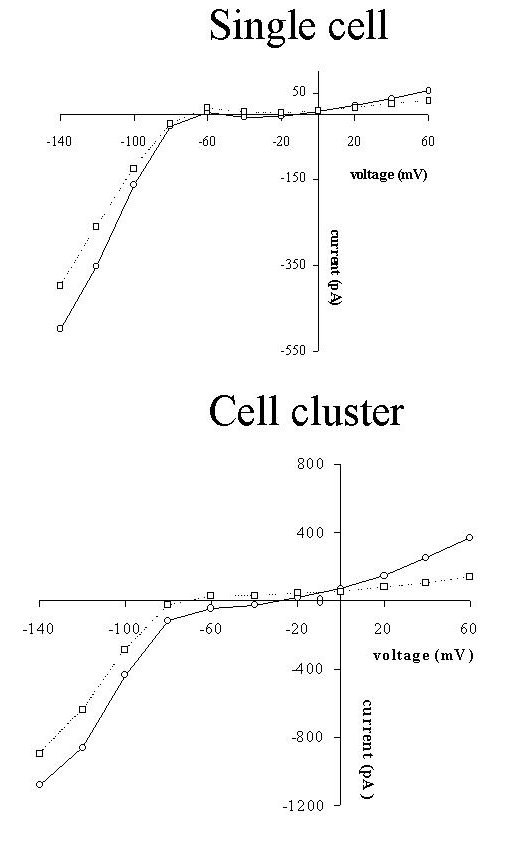
Fig. 2: Steady-state I-V relations for the single cell (top) and cell cluster (bottom) of figure 1. Relations were determined at the start (full line) and at the end (dotted line) of the experiments, i.e. 60 min for the single cell and 25 min for the cell cluster.
Click to enlarge
Fig. 2: Steady-state I-V relations for the single cell (top) and cell cluster (bottom) of figure 1. Relations were determined at the start (full line) and at the end (dotted line) of the experiments, i.e. 60 min for the single cell and 25 min for the cell cluster.
As a result current-voltage (I-V) and charge-voltage (Q-V) relations as shown in figures 2 and 3 were obtained. As well for the single cell as for the cell cluster, steady-state I-V and Q-V relations were determined at the beginning (full lines) and end (dotted line) of the experiment (60 minutes for the single cell or 25 minutes for the cell cluster). The I-V relations in figure 2 all had a similar shape with a large inwardly rectifying K+ current (Iki) at negative potentials and a small outwardly rectifying current, which is probably the background Cl- current (ICl) (Fransen and Sys, 1997) at positive potentials. In the cell cluster, steady state membrane currents were larger than for the single cell. Voltage clamping the cell or cell cluster for 60 or 25 min only slightly attenuated Iki and ICl, suggesting no toxic effects of the diffusing dyes.
 Click to enlarge
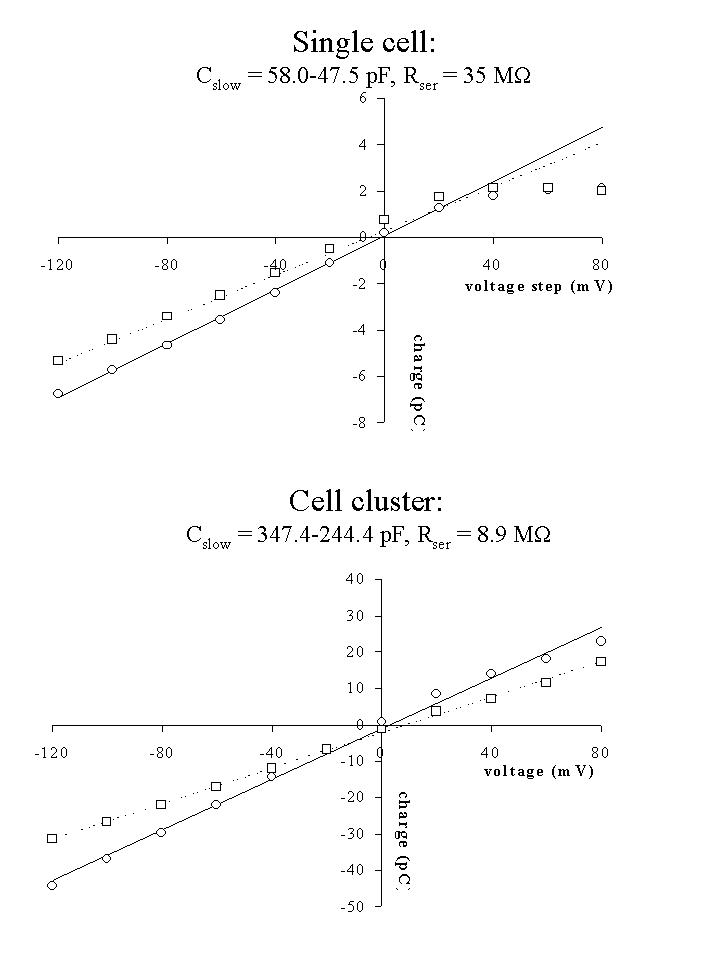
Fig. 3: Q-V relations for the single cell (top) and cell cluster (bottom) of figure 1. Q was measured as the integral of the current transient upon return from the test voltage to the holding potential and plotted as a function of the voltage step. The slope of the relationship determined the cell (cluster) slow capacity (Cslow = Q/V).
Click to enlarge
Fig. 3: Q-V relations for the single cell (top) and cell cluster (bottom) of figure 1. Q was measured as the integral of the current transient upon return from the test voltage to the holding potential and plotted as a function of the voltage step. The slope of the relationship determined the cell (cluster) slow capacity (Cslow = Q/V).
The linear Q-V relations in figure 3 revealed a displaced charge for the cell cluster 6 times as large as the displaced charge for the single cell. Cell capacity was 58.0 pF for the single cell and 347.4 pF for the cell cluster. During the experiments, these values decreased to 47.5 pF and 244.4 pF after 60 min or 25 min respectively. Results suggest electrical coupling between the cells in a cluster.
 Click to enlarge
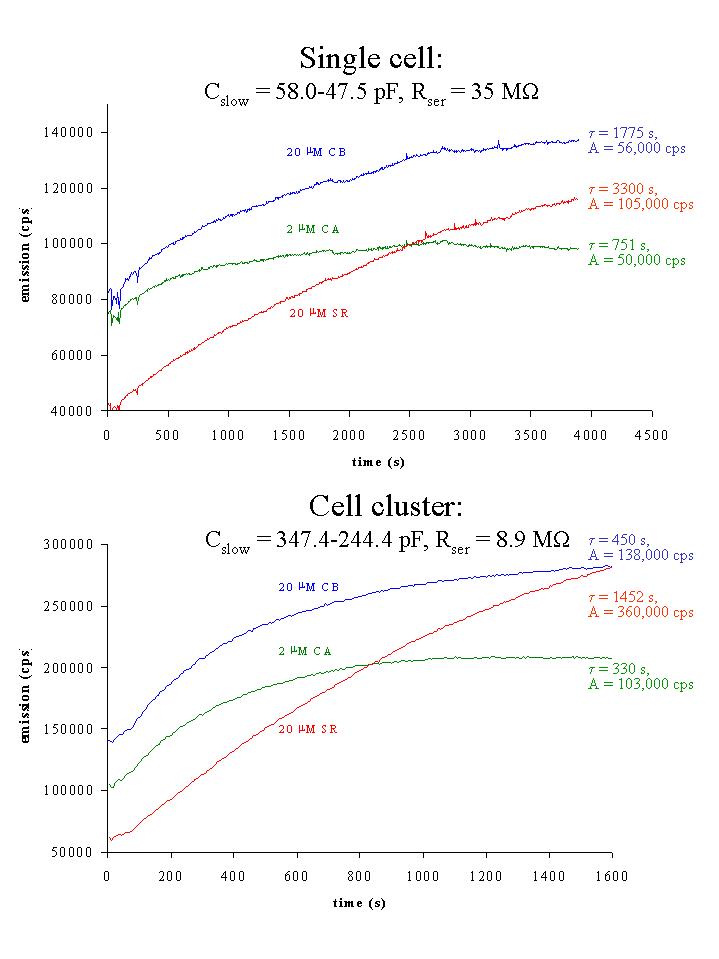
Fig. 4: Time-dependent increase of emission (cps) for cascade blue (CB, blue), calcein (CA, green) and sulforhodamine (SR, red) for the single cell (top) and cell cluster (bottom) of figure 1. Time constant and amplitude of monoexponential fits to the data are indicated.
Click to enlarge
Fig. 4: Time-dependent increase of emission (cps) for cascade blue (CB, blue), calcein (CA, green) and sulforhodamine (SR, red) for the single cell (top) and cell cluster (bottom) of figure 1. Time constant and amplitude of monoexponential fits to the data are indicated.
2) Microfluorometric recordings: Dye coupling was studied by measuring dye emission intensity as a function of time during the course of the experiments. The cell or cell cluster was alternatively excited at 390 nm for CB, 482 nm for CA and 590 nm for SR during 2 s, revealing three emission-time traces according to each dye (figure 4). Upon going from cell-attached to whole-cell mode at t = 100 s (single cell) or at t = 50 s (cell cluster), the dyes diffused to the cell(s) under voltage clamp and the intensity of dye emission, expressed as cps, increased with time. The time-dependence of dye emission could be described with a monoexponential function. Mean time constants (mean ± SEM) were 459 ± 120 s for CB (Rser: 3.4 - 40.0 Mohm, n = 14), 352 ± 76 s for CA, (Rser: 3.3 - 40.0 Mohm, n = 13) and 1062 ± 218 s for SR (Rser: 2.8 -40.0 Mohm, n = 18). In 8 experiments, in which we combined CA, CB and SR, the time constants for CB and SR were respectively 2.02 ± 0.29 and 3.49 ± 0.50 times larger than the time constant for CA. Both CA and CB were significantly faster diffusing than SR. The higher series resistance in the experiment with the single cell in figure 4 (top) can explain the larger time constants for dye diffusion in the single cell. In each experiment the amplitude of the monoexponential increase of dye emission was also determined. This amplitude, for a given dye at a given concentration, might be considered as an indication of the number of dye-coupled cells. In figure 4, there was a 2.0 to 3.5 time increase in the amplitude of the monoexponential, suggesting dye coupling in this experiment.
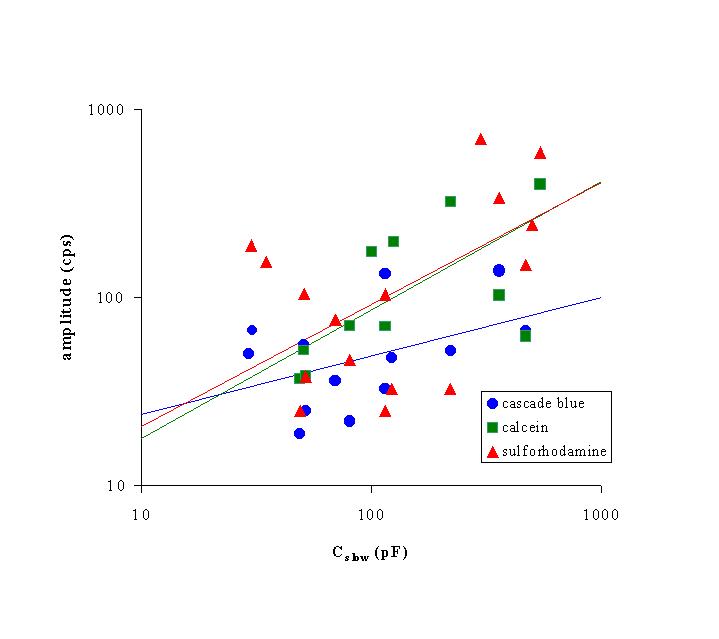 Click to enlarge
Fig. 5: Relationship between log(Cslow) of single cells and clusters and log(amplitude of dye emission) for CB (blue circles, n = 14), CA (green squares, n = 13) and SR (red triangles, n = 18). Straight lines were fits to the equation amplitude = a * Cslowb, with
Click to enlarge
Fig. 5: Relationship between log(Cslow) of single cells and clusters and log(amplitude of dye emission) for CB (blue circles, n = 14), CA (green squares, n = 13) and SR (red triangles, n = 18). Straight lines were fits to the equation amplitude = a * Cslowb, with
         dye         a               b            correlation coefficient
---------------------------------------------------------------------------
        CB        11.8          0.31                    0.44
        CA         3.8          0.67                    0.75
        SR         4.7          0.65                    0.61
3) Comparison of electrophysiological and microfluorometric cell coupling: In figure 5, the amplitude of monoexponential fits of the time-dependent increase of emission for CB (n = 14), CA (n = 13) and SR (n = 18) was plotted on a logarithmic scale against the slow capacity of the cells or cell clusters on a logarithmic scale. Results revealed that for each dye the amplitude was proportional with Cslow to the power 0.58 (± 0.12) (Analysis of Covariance, p < 0.001), suggesting more dye diffusion to cells or cell clusters, which have a higher Cslow. The time constant of dye diffusion was, however, independent of Cslow (Analysis of Covariance, p = 0.43).
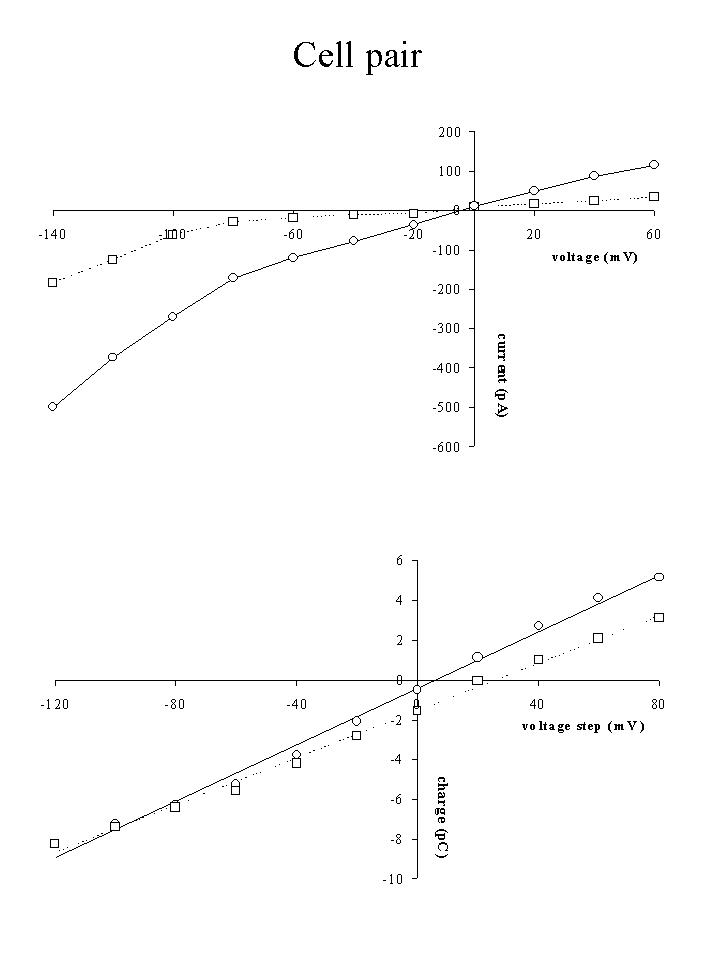 Click to enlarge
Fig. 6: Steady-state I-V (top) and Q-V (bottom) relation for a cell pair in the presence (dotted line) and absence (full line) of 1 mM 1-heptanol.
Click to enlarge
Fig. 6: Steady-state I-V (top) and Q-V (bottom) relation for a cell pair in the presence (dotted line) and absence (full line) of 1 mM 1-heptanol.
4) Effects of octanol/heptanol on cell coupling: To investigate the contribution of gap junctions to the dye transfer to neighbouring cells, experiments were performed in the presence of the gap junctional inhibitor heptanol or octanol. Figures 6 and 7 show the results of an experiment, in which 1 mM 1-heptanol was added to a cell pair at the beginning of the experiment. The presence of 1-heptanol not only decreased steady-state membrane currents (figure 6, top), but also decreased the slope of the Q-V relation (capacitance, figure 6, bottom) from 70.8 pF to 59.0 pF. When dye emission was studied as a function of time (figure 7), the presence of heptanol inhibited dye diffusion to the second cell for the faster dyes CA and CB, but not for the slower SR, which was probably still diffusing to the cell under the patch pipette. After 1200 to 1300 s, emission of the three dyes increased again, suggesting that diffusion to the second cell via gap junctions was possible again. A monoexponential fit of the data between 100 and 1200 s gave time constants and amplitudes as indicated in the figure.
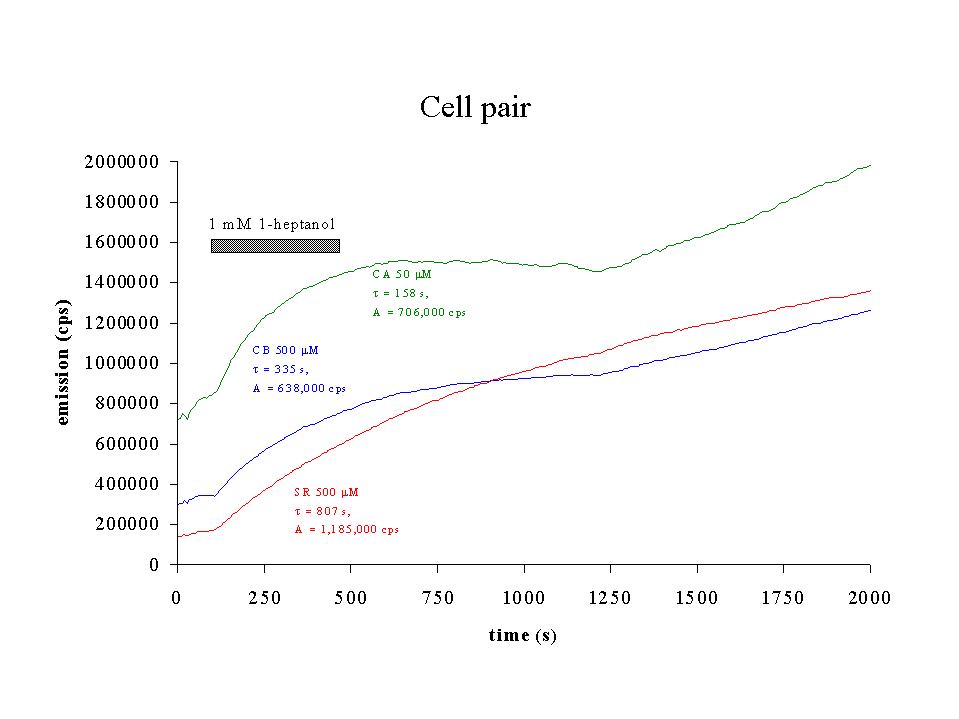 Click to enlarge
Fig. 7: Time-dependent increase of emission (cps) for cascade blue (CB, blue), calcein (CA, green) and sulforhodamine (SR, red) for the cell pair of figure 6. Time constant and amplitude of monoexponential fits to the data between 100 and 1200 s are indicated. The presence of 1 mM 1-heptanol is indicated by the black bar.
Click to enlarge
Fig. 7: Time-dependent increase of emission (cps) for cascade blue (CB, blue), calcein (CA, green) and sulforhodamine (SR, red) for the cell pair of figure 6. Time constant and amplitude of monoexponential fits to the data between 100 and 1200 s are indicated. The presence of 1 mM 1-heptanol is indicated by the black bar.
Discussion and Conclusion
The present study demonstrated that the combination of electrophysiological techniques with microfluorometric techniques allows the investigation of gap junctional coupling between cultured endocardial endothelial cells. Electrical coupling of endothelial cells through gap junctions has been described in cultured guinea-pig coronary endothelial cells (Daut, Mehrke, Nees and Newman, 1988). In cell clusters of cultured endocardial endothelial cells, we observed that the capacitive current transients upon voltage steps were much larger than in single cells. This observation suggests that the membranes of all cells in a cell cluster behave as one large capacitor, which was charged up through the series resistance of the gap junctions (Daut et al., 1988). The cluster capacity can, therefore, be considered as a measure of the total membrane surface of the cluster (specific membrane capacity of 1 µF/cm2) and, hence, of the number of cells in a cluster. In addition to increased capacitive transients, larger membrane ionic currents were also measured. This indicated that the input resistance of the cells in a cluster was lower than that in single cells, probably also because of the gap junctions between the cells in a cluster.
Together with the electrical studies, dye coupling between the cells was studied with microfluorometric techniques, . Two anionic (CA and CB) and one neutral (SR) fluorescent tracer of a similar molecular weight, were combined to investigate diffusion from the patch pipette to single cells and to cell clusters. Diffusion of the three dyes from the pipette could be described with a monoexponential function. Time constants for SR were 1.7 to 3.5 times slower than for CB and CA, in both single cells and cell clusters. Neither for SR nor for CA or CB the time course of diffusion was influenced by the electrical capacity of the cell or cell cluster. The presence of gap junctions between cells did not increase the resistance to dye diffusion. In hamster cheek pouch arteriolar endothelial cells Little, Xia and Duling (1995) also found neutral, cationic and anionic dyes to display similar extents of cell coupling. Nevertheless, the presence of the gap junction proteins or connexins (Cx 37, Cx40 and Cx43) was demonstrated in endocardial endothelial cells (Andries, 1994; Brutsaert et al., 1998) and these connexins have been described to be cation-selective (Veenstra et al., 1994a, b). At present, it cannot be excluded that cationic dyes pass the gap junctions between endocardial endothelial cells better than neutral or anionic dyes.
The amplitude of the monoexponential increase of dye emission for the different dyes was proportional to the electrical capacity of the endothelial cells and, therefore, also to the number of cells in a cluster, suggesting dye diffusion to neighbouring cells through the gap junctions. For the three dyes tested, no statistically significant difference in the slope of the relation between log cps and log Cslow was found. This might again indicate that the three dyes pass the gap junctions between the cells equally well. The inhibition of dye and electrical coupling with gap junctional uncouplers such as heptanol or octanol (Rudisuli and Weingart, 1989; Fransen, Andries, Van Bedaf, Demolder & Sys, 1996), finally, suggested that coupling occurred through the gap junctions and not through cytoplasmic bridges between cells in culture.
In conclusion, the present study demonstrated electrical and dye coupling through gap junctions between cultured endocardial endothelial cells. This might have important functional implications for the role of the endocardial endothelium as modulator of cardiac contractility and rhythmicity. The presence of extensive intercellular communication between endocardial endothelial cells and the putative absence in myocapillary endothelial cells may indicate different signalling mechanisms with the nearby cardiomyocytes. Unlike morphological evidence for the expression of cation selective connexins in these cells, dye transfer was not selective for cascade blue, calcein nor sulforhodamine, which are anionic or neutral. Experiments with positively charged dyes are now in progress. Together with a more detailed CCD-imaging study of the time-dependent gap junctional spreading of dyes through the gap junctions, this will provide more information on the role of gap junctional coupling between endocardial endothelial cells and on their intercellular communication.
References
- Andries LJ (1994) Endocardial Endothelium: Functional Morphology, RG Landes, Austin, Texas: 66-73
- Beny J-L and Pacicca C (1994) Bidirectional electrical communication between smooth muscle and endothelial cells in the pig coronary artery. American Journal of Physiology, 266: H1465-H1472
- Beny J-L, Zhu PL and Haefliger IO (1997) Lack of bradykinin-induced smooth muscle cell hyperpolarization despite heterocellular dye coupling and endothelial hyperpolarization in porcine ciliary artery. Journal of Vascular Research, 34: 344-350
- Brutsaert DL, Fransen P, Andries LJ, De Keulenaer GW and Sys SU (1998) Cardiac endothelium and myocardial function. Cardiovascular Research, 38: 281-290
- Brutsaert DL, Meulemans AL, Sipido KR and Sys SU (1988) Effects of damaging the endocardial surface on the mechanical performance of isolated cardiac muscle. Circulation Research, 62: 358-366
- Daut J, Mehrke G, Nees S and Newman WH (1988) Passive electrical properties and electrogenic sodium transport of cultured guinea-pig coronary endothelial cells. Journal of Physiology London, 402: 237-254
- Drumheller PD and Hubbell JA (1991) Local modulation of intracellular calcium levels near a single-cell wound in human endothelial monolayers. Arteriosclerosis and Thrombosis, 11: 1258-1265
- Fransen P, Andries LJ, Van Bedaf D, Demolder M and Sys SU (1996) Cell coupling in cultured endocardial endothelium. Pfluegers Archiv-European Journal of Physiology, 431: R323 (abstract)
- Fransen PF, Demolder MJM and Brutsaert DL (1995) Whole cell membrane currents in cultured pig endocardial endothelial cells. American Journal of Physiology, 268: H2036-H2047
- Fransen P and Sys SU (1997) K+ and Cl- contribute to resting membrane conductance of cultured porcine endocardial endothelial cells. American Journal of Physiology, 272: H1770-H1779
- Li K, Rouleau JL, Andries LJ and Brutsaert DL (1993) Effect of dysfunctional vascular endothelium on myocardial performance in isolated papillary muscles. Circulation Research, 72: 768-777
- Little TL, Xia J and Duling BR (1995) Dye tracers define differential endothelial and smooth muscle coupling patterns within the arteriolar wall. Circulation Research, 76: 498-504
- Rubanyi GM (1991) Endothelium-derived relaxing and contracting factors. Journal of Cellular Biochemistry, 46: 27-36
- Rudisuli A and Weingart R (1989) Electrical properties of gap junction channels in guinea-pig ventricular cell pairs revealed by exposure to heptanol. Pfluegers Archiv-European Journal of Physiology, 415: 12-21
- Sammak PJ, Hinman LE, Tran POT, Sjaastad MD and Machen TE (1997) How do injured cells communicate with the surviving cell monolayer? Journal of Cell Science, 110: 465-475
- Veenstra RD, Wang HZ, Beyer EC and Brink PR (1994) Selective dye and ionic permeability of gap junction channels formed by connexin 45. Circulation Research, 75: 483-490
- Veenstra RD, Wang HZ, Beyer EC, Ramanan SV and Brink P (1994) Connexin 37 forms high conductance gap junction channels with subconductance state activity and selective dye and ionic permeabilities. Biophysical Journal, 66: 1915-1928
- Von der Weid PY and Beny J-L Simultaneous oscillations in the membrane potential of pig coronary artery endothelial and smooth muscle cells. Journal of Physiology London, 471: 13-24
| Discussion Board | Previous Page | Your Symposium |