CONTENTSĀ
Introduction
Sonography belongs to a group of diagnostic methods which have run a stormy
course in the last decade. As a noninvasive method, deemed safe for both
examiner and patient, sonography involves radiation of nondamaging doses
of ultrasound (US) energy only. The major hazard for patients undergoing
sonography consists in potential wrong diagnosis. Valid diagnosis in turn
depends on the experience of the examiner and quality of the image of the
particular sonograph used. Technical developments on the other hand have
contributed to the wide range of variable quality equipment available on
the market. The technical features of such equipment are not easy to evaluate
and urgently needed is a simple, objective and sufficiently accurate method
for verifying the quality of the sonograph and thus the image produced.
One of the essential criteria determining the accuracy of instruments like
this is spatial resolution (SR). This is the criterion now utilised for
the evaluation system described below.Ā
Definition of the problem
Spatial resolution has three components: Axial-, Lateral and Transverse
Resolution. Axial SR is influenced mainly by the ultrasound (US) frequency
used and very little by the construction of the probe. In contrast, the
SR in lateral and transverse planes is dependent on both the construction
of the probe, method used for its focusing and the processing of the signal
pathway from probe to output as image. The most frequently used device
for the evaluation of spatial resolution, is a special measuring phantom
which consists of a medium for the predetermined attenuation of US energy,
in which different reflecting targets are placed. The image of these reflectors
however, leads to more or less subjective judgement of the level of SR
of the instrument being evaluated. The accuracy of measurement here can
be jeopardised mainly through subjective error and/or nonstandard measurement
procedures. Its advantages are that it includes all links in the image
chain from probe to monitor and measurement is quick and simple. For the
reason we looked for a method for objectifying this process and at the
same time maintain its advantages.Ā
Solution
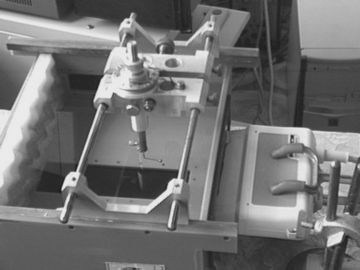
At our institute we have constructed a measuring tank with a point reflector
whose position can be changed in all three axes. This ensures a standard
input. For evaluation of the output information advantage is taken of the
fact that all sonographs are equipped with a standardised videosignal output.
With the help of digitalisation of the videosignal we obtain a bitmap picture
in which we are able to evaluate the SR in the lateral plane and the signal
dynamic. The software used for the above is APROFIL, which is a part of
the programme package ARCHIVis APROFIL, a part of ARCHIV program package
(supplied by CONDATA s.r.o., Olomouc, Czech Republic) and routinely used
in theroutinely used at the Clinic of Gynaecology and Obstetric and Gynaecology
Clinics of the Medicals of the Faculty Hospital in Olomouc for archival
sonographic images.Ā
Results
The system described fulfills the criteria for solving the outlined problem
and enables us now to measure the parameters of both the axial and transversal
resolutions. Aditionally we can appreciate dynamic range ofĀ signal, gray
scale parameters, the amplitude of videosignal and level of side lobes.Ā
To evaluate our method we examined four sonographs with different transducers
working on the frequencies of 3 and/or 5 MHz.Ā
Ā
Using ball reflectors of different diameter 6 and 0,4 mm we at first checked the independence on the reflector diameter. The results obtained with both reflectors were very similar in the focal area but slightly differed in fare field area. Therefore we used the smaller one for further examinations.Ā
The data extracted from bitmap pictures were interpolated by software MATLAB into 3D graph. The lateral resolution (LR) was estimated from the 3D function for different depth generating the lateral resolution characteristic displayed in the Graph No 2. The position of the focal area declared by producer was compared with the estimated one. The results - value of lateral resolution and focal lengths are shown in the Tab.1 .Ā
Conclusions
The method gives reliable results for sonographs quality assessment. The
work will be continued so that the use of the method can spread and more
parameters, e.g. side-lobes amplitude measurement, can be evaluated.Ā
| Transducer number | Frequency | lateral resolution estimated | focal length declared | focal length estimated | maximal amplitude | scanning system |
|---|---|---|---|---|---|---|
| MHz | mm | mm | mm | units | ||
| 1 | 3.5 | 3.6 | 40 | 30 - 50 | 184 | mechanic |
| 2 | 5 | 2.8 | 40 | 40 | 174 | mechanic |
| 3 | 3.5 | 2.6 | 80 | 50 - 70 | 168 | electronic |
| 4 | 3 | 6.1 | NA | 70 | 238 | mechanic |
| 5 | 5 | 4.8 | NA | 50 | 238 | mechanic |