Invited Symposium: Molecular Mechanisms of Ageing
| INABIS '98 Home Page | Your Session | Symposia & Poster Sessions | Plenary Sessions | Exhibitors' Foyer | Personal Itinerary | New Search |
Results
Results To begin to identify mRNAs that are selectively translated at synapses we isolated synaptoneurosomes from the cortex of 12 day-old Long-Evans rats.
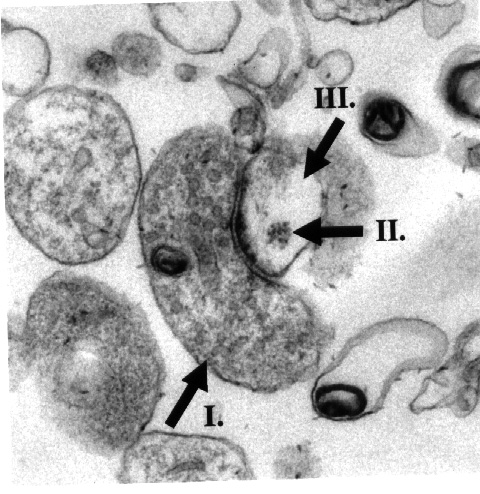 Fig. 2: Electron micrograph of an isolated synpatoneurosome showing a presynaptic terminal (I), a postsynaptic terminal (II) and a polyribosome aggregate (III).
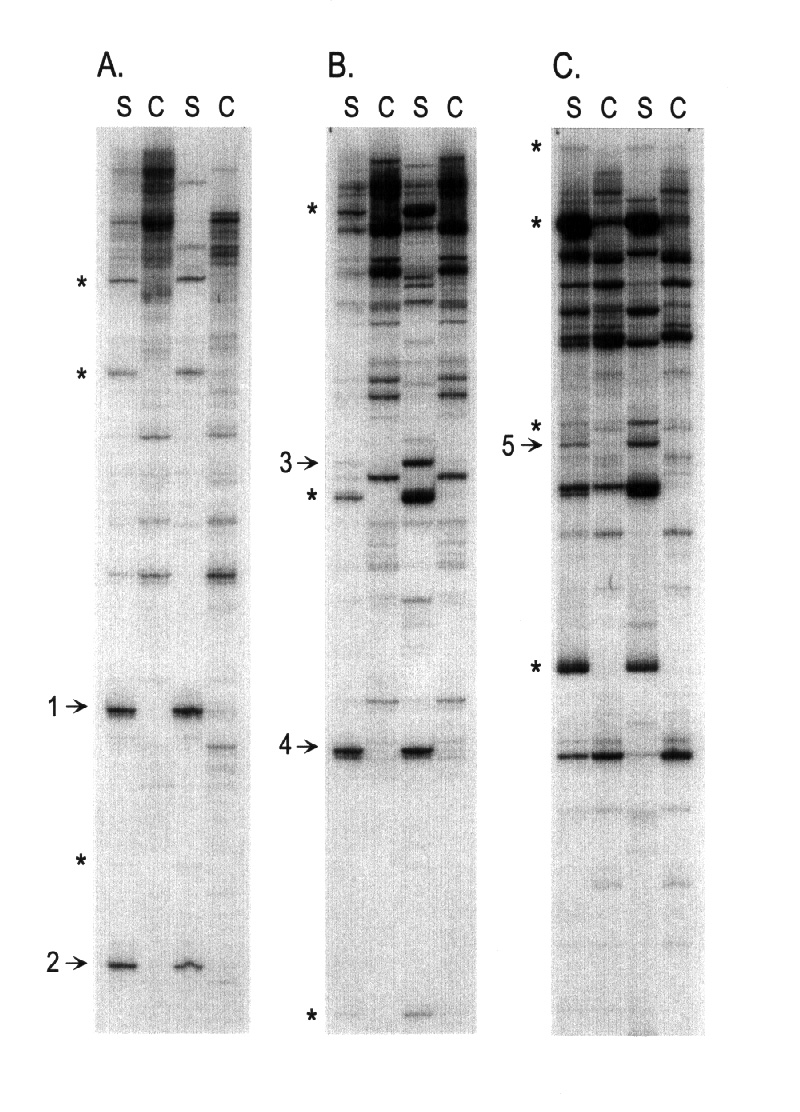
Total RNA isolated from these synaptoneurosomes was compared to total cortex RNA using differential display (DDRT-PCR) with the following set of primers:
Table 1.
3' Primers     Sequence
_____________________________________________
dT             51 TTT TTT TTT TTT T 31
dT1            51 GCG CAA GCT12 GC 31
dT2            51 GCG CAA GCT12 GG 31
dT3            51 GCG CAA GCT12 GA 31
5' Primers     Sequence
_______________________________________________
A1             51 CGG ATC GAC TCC AAG 31
A2             51 CGG TAT CGA TAC AGG 31
A3             51 CGG CTG ATC CAT GC 31
A5             51 CGG GTC TGC TAG GTA 31
A6             51 CGG AGA CGC TAG TGT 31
A7             51 CGG ATC TTT CTA CCC 31
_______________________________________________
A selection of differentially displayed is shown in Figure 3.
 Click to enlarge
Fig. 3: Representative DDRT-PCR of Synaptoneurosomal (S) and Cortex (S) RNAs. DDRT-PCR bands using three different primer combinations (A) A1/dT1, (B) A2/dT1, (C) A2/dT2. The left pair of DDRT-PCR bands on each gel panel are from reactions with MMLV reverse transcriptase; the right pair or bands are from reactions with and Superscript II reverse transcriptase. Bona fide candidate bands 1-5 (Table 2.) are those bands that are differentially expressed in both sets of RT reactions 9,10. * bands were differentially expressed, but could not be re-amplified.
Click to enlarge
Fig. 3: Representative DDRT-PCR of Synaptoneurosomal (S) and Cortex (S) RNAs. DDRT-PCR bands using three different primer combinations (A) A1/dT1, (B) A2/dT1, (C) A2/dT2. The left pair of DDRT-PCR bands on each gel panel are from reactions with MMLV reverse transcriptase; the right pair or bands are from reactions with and Superscript II reverse transcriptase. Bona fide candidate bands 1-5 (Table 2.) are those bands that are differentially expressed in both sets of RT reactions 9,10. * bands were differentially expressed, but could not be re-amplified.
A total of 60 such bands were isolated using this procedure, 20 of which were cloned and sequenced. A summary of the different clones that were isolated is given in Table 2.
Table 2.
Primer Pair1Size     Identity
_________________________________________________
Actin                  246      Ax-actin
1-1                    246      Tip60a
1-1                    138      Osteonectin
1-2                    395      EST193443
1-2                    231      Ceramide gluc. transferase
2-2                    388      ZBP-89
3-1                    155      rpL18a
1-5                     95      calmodulin binding protein
2-5                    143      EST UI-R-E0-cj-d-08-0-UI.S1
2-5                    140      EST-UI-R-E0-bw-f-06-UI.S1
2-5                    118      Mitochondrial cytochrome B
2-6                    140      Unique
2-7                    220      Unique
2-7                    197      EST HUM404H10B
2-7                    116      rpS29
_________________________________________________
1. Primer Pair= 31dTx/51Ay where x and y
are the different primers shown in Table 1.
Touchdown RT-PCR was then used to quantify the message levels in synaptoneurosome RNA and cortex RNA; this allowed us to determine whether the cloned cDNAs were, in fact, derived from mRNAs enriched in synpatoneurosomes. The strategy used is outlined in Figure 4.
 Click to enlarge
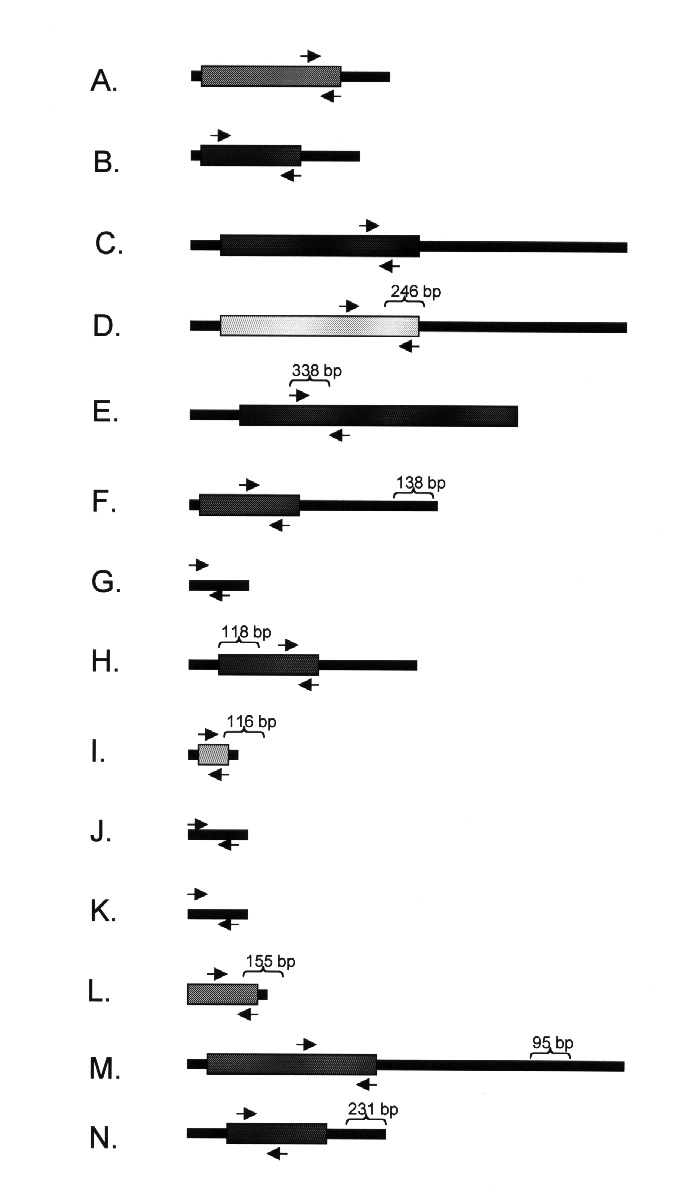
Fig. 4: Primer Design for Touchdown RT-PCR. RT-PCR primers were designed to the coding sequences (CDS) of the eight known mRNAs in Table 2 as well as FMR1 and G3PDH mRNAs that served as controls. Nested primers were designed to three of the four ESTs. Arrows show the location of the forward and reverse primers for each RNA (drawn to scale). Brackets show the location and size of the corresponding DDRT-PCR clone. RNAs for: (A) actin, (B) G3PDH, (C) FMR1, (D) Tip60a, (E) ZBP89, (F) Osteonectin, (G) EST193443, (H) ctyochrome B, (I) ribosomal protein S29, (J) EST UI-R-E0-cj-d-08-0-UI.S1, (K) EST UI-R-EO-bw-f-06-0-UI.S1, (L) ribosomal protein L18a, (M) Vesicle-associated calmodulin binding protein, and (N) ceramide glucosyltransferase were analyzed.
Click to enlarge
Fig. 4: Primer Design for Touchdown RT-PCR. RT-PCR primers were designed to the coding sequences (CDS) of the eight known mRNAs in Table 2 as well as FMR1 and G3PDH mRNAs that served as controls. Nested primers were designed to three of the four ESTs. Arrows show the location of the forward and reverse primers for each RNA (drawn to scale). Brackets show the location and size of the corresponding DDRT-PCR clone. RNAs for: (A) actin, (B) G3PDH, (C) FMR1, (D) Tip60a, (E) ZBP89, (F) Osteonectin, (G) EST193443, (H) ctyochrome B, (I) ribosomal protein S29, (J) EST UI-R-E0-cj-d-08-0-UI.S1, (K) EST UI-R-EO-bw-f-06-0-UI.S1, (L) ribosomal protein L18a, (M) Vesicle-associated calmodulin binding protein, and (N) ceramide glucosyltransferase were analyzed.
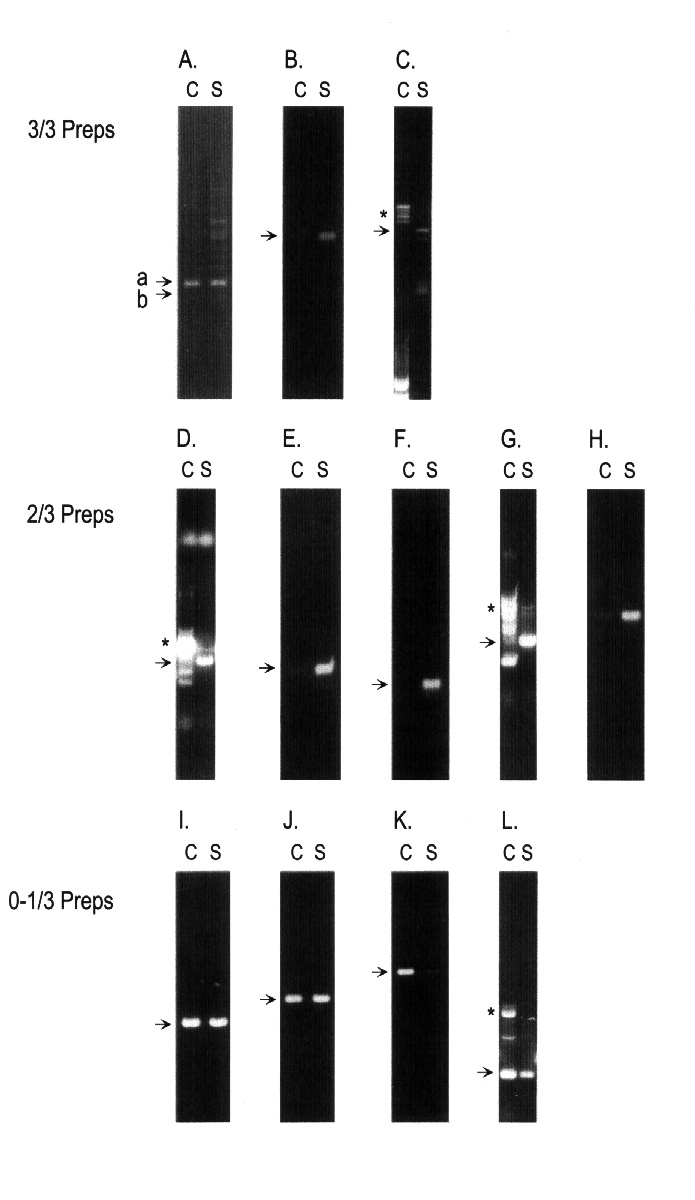
Three independent synaptoneurosome/cortex RNA pairs were used in this analysis. The results are summarized in Figure 5.
 Click to enlarge
Figure 5. Touchdown RT-PCR of Synaptoneurosome enriched RNAs.
(A-C) RNAs selectively enriched in all three synaptoneurosome (S)/cortex (C) preparations. Panels are (A) Ax-actin (b); and b-actin (a) shown for comparison, (B) ceramide glucosyl transferase, (C) ZBP89.
(D-H) RNAs selectively enriched in two of three three synaptoneurosome (S)/cortex (C) preparations. Panels are (D) vesicle-associated calmodulin binding protein, (E) ribosomal protein L18a, (F) ribosomal protein S29, (G) osteonectin, (H) EST UI-R-E0-cj-d-08-0-UI.S1.
(I-L) RNAs selectively enriched RNAs selectively enriched in only the DDRT-PCR synaptoneurosome (S)/cortex (C) preparation. Panels are (I) EST UI-R-EO-bw-f-06-0-UI.S1, (J) cytochrome c, (K) G3PDH, (L) EST193443. Two amplicons, FMR1 and Tip60a, did not produce specific fragments in any of the RT-PCR assays. * indicates non-specific amplification.
Click to enlarge
Figure 5. Touchdown RT-PCR of Synaptoneurosome enriched RNAs.
(A-C) RNAs selectively enriched in all three synaptoneurosome (S)/cortex (C) preparations. Panels are (A) Ax-actin (b); and b-actin (a) shown for comparison, (B) ceramide glucosyl transferase, (C) ZBP89.
(D-H) RNAs selectively enriched in two of three three synaptoneurosome (S)/cortex (C) preparations. Panels are (D) vesicle-associated calmodulin binding protein, (E) ribosomal protein L18a, (F) ribosomal protein S29, (G) osteonectin, (H) EST UI-R-E0-cj-d-08-0-UI.S1.
(I-L) RNAs selectively enriched RNAs selectively enriched in only the DDRT-PCR synaptoneurosome (S)/cortex (C) preparation. Panels are (I) EST UI-R-EO-bw-f-06-0-UI.S1, (J) cytochrome c, (K) G3PDH, (L) EST193443. Two amplicons, FMR1 and Tip60a, did not produce specific fragments in any of the RT-PCR assays. * indicates non-specific amplification.
| <= Materials & Methods | RESULTS | Discussion & Conclussions => |
| Discussion Board | Next Page | Your Symposium |