AND METHODS
| INABIS '98 Home Page | Your Symposium | Related Symposia & Posters | Scientific Program | Exhibitors' Foyer | Personal Itinerary | New Search |
COLOR SEGMENTATION. ITS EMPLOYMENT IN THE STUDY OF THE ANGIOGENESIS. PART I
Roberto Rodríguez M., Teresa E. Alarcón, Ingrid C. Bisset, Roberto W. Navarro (+) and Leudis S. Cuello.
E mail: rrm@cidet.icmf.inf.cu
Digital Image Processing (DIP) is one of the science branches that more development has experimeted in the last decade, due fundamentally to two factors: first, to the dizzy advance that it has been originated in the hardware, and second, to the importance that this technology has acquired in modern life. One of the fields most favored with the DIP technical is, no doubt, the medicine, where, for the certainty diagnostic, is necessary the employment of cuantification tools of high precision. Within of medicine field the pathological anatomy, which studies morphological aspects or structural of the diseases, is one of the specialties that, perhaps, more requires of the utilization of the DIP, since permits to diminish the visual weariness that produces the work extended with the microscope and, at the same time, guarantees certainty diagnostic of the diseases.
The angiogenesis process is an important aspect in the histopathological study of diseases, characterized by the formation of new blood vessels in the tissue, which increases its growing and development. This vascular new formation is a normal process in all tissues and a series of pathological states, for example, the case of the malign tumors. It is known, for example, that in the mammary, prostate, bladder and brain tumoral tissues, the number of blood vessels is as greater as more advanced is the disease [16], [19], [1], [8].
For that reason, an important problem to solve using DIP technical, is the segmentation or isolation of blood vessels in tumoral tissues, for its posterior morphometrical analysis.
It is known that the first step of the image analysis consist, generally, in to segment the scene [4]. The segmentation subdivides an image in its constituent parts or objects, but this is a step that is not trivial, because the level in which this subdivision is carried out depends on the problem to solve and on the original image. The segmentation process, in general, never results perfect, and ends or is stopped when the objects of interest have been isolated.
The main objective of the present work is to isolate the blood vessels in images of histological cut of malign tumors of soft parts for its posterior characterization through morphometrical technical. This process is even more difficult due to the complex form that is originated in the objects to segment (blood vessels) upon making the cut of tissue, where the disposition of blood vessels are always different.
Furthermore, the intrisic noise that images have, influences negatively in the segmentation, due to hardware used. In the work are used color images which increase the computacional cost. So, an additional purpose was to obtain a rapid and acceptable method, all this in the environment of a personal computer (PC).
The organization of this article is as follows: in the section 2 is described the medical methodology and the employed optics, as well as the characteristics of the acquired images.
In the section 3 is detailed the implementation of differents segmentation methods and the obtained results; finally, in the section 4 are exposed the conclusions.
2.1 Medical Methodology
In this work were used histological cut of malign tumors of soft parts included in paraffin and inmunohistoquimic
technical for the method of the avidina biotina complex (ABC) and monoclonal CD34 contrasted with green methyl to accentuate the vascular new formation (angiogenesis).
2.2 Optical system
The preparations were observed in a binocular microcospe with increase of 200x, coupled to a TV camera which sign is injected to PC through A/D converter.
2.3 Characteristic of the study images
In the figure 1 is shown an example of the type image to study image which represent a histological cut of malign tumors of soft parts. This scene was captured by using MADIP system [13] with a resolution of 512x256x8 bit/pixels.
Due to A/D converter used and the employed optics (is included the TV camera), these images are characterized by to be very noisy which will be appreciated with posteriority.
Figure 1. Image of histological cut of malignant tumors of soft
parts (ABC, CD34, x200).
In the example of the figure 1, also, it can be observed as there is little contrast between the background and the blood vessels, which is evidenced by form of the histograms for each one of the channels. These are shown in the figure 2. It can be verified that these histograms are, practically unimodals and have very similar forms. These two main characteristics (under contrast and noise) were, as a rule, common for all the scenes that were processed. These properties were considered for the subsequent processings.
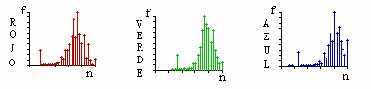
Figure 2. Histogram of the study image by each
channel, where n and f
represent the gray levels and the frequency respectively.
3.1 Pre processing and post processing method.
It is known that all segmentation process stresses the high frequencies which are very close to the noise. Taking into consideration that the scenes to process are very noisy, they were subjected to low pass filter. It was experienced with two types of masks, one of 3x3 and other of 5x5.
The mask of 5x5 did not give good results. This mask attenuated strongly the noise, but also produced a deterioration notable in the edges of the blood vessels, which it was not what is wished. This result is explained by the fact that the 5x5 low pass filter attenuates very strongly, in this case, the high frequencies existing in the image, what stresses the low contrast. With the 3x3 mask the result was better and it was the choice. The filtered process was carried out in vectorial way according to proposed by [22].
The filterd processing and segmentation in a first version is realized for the red channel, green and blue as shows the figure 3.
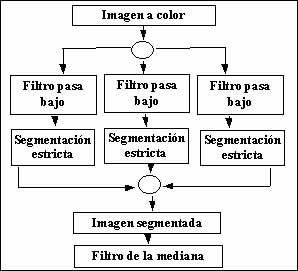
Figure 3. Processing form of the color image.
As it can be observed in the figure 3 once the images were segmented by each channel, they were subjected to a post processing through median filter with the objective of eliminating the pepper noise that were originated. This will be explained with more detail there in after.
The final objective of the segmentation process was obtain a binary image composed by the blood vessels and the background.
3.2 Segmentation tehnique. Results and discussion.
Taking into consideration what is expressed previously, and with the objective of obtain a rapid and effective method in an environment of personal computer, it was experienced with several segmentation tehniques, to know:
a) Point wise strict thresholding tehnique.
b) Local supervised tehnique with statistics of first order.
c) Segmentation tehnique by the Chiralo method [2].
d) Point wise thresholding tehnique adapted to local.
Definition
In general the strict segmentation can be defined as continues:
Let set N a joint of natural numbers, let set (x, y) the spatial coordinates of a digitized image, and let set G = {0,1, 2,. .., 2B} a set of positive numbers that represent the gray levels, where B is the number of bits. Then, it can be defined an image function, f:NxN-->G. The brilliancy (gray levels) of a pixel with coordinates (x, y) is denoted as f(x,y).
Let set t Î G a threshold and let set C={c0,c1} a pair of binary gray levels (c0, c1 Î G). The result of to segment an image function f(.,.), in a strict way, in the gray level ç is the binary function ft : NxN --> C, such that:
![]()
3.2.1 Point wise technique
A first step was to apply a point wise strict thresholding tehnique. In the figure 4 is shown the obtained result of to apply this strict segmentation tehnique, called the Otsu [10] method, to the image filtered of the figure 1.

Figure 4. Segmented image punctually according to the Otsu method.
As it were expected, the result of the segmentation was very bad, none of blood vessels were discriminated. This accentuate what other authors already have demonstrated related to that the point wise methods not give good results, much less, as there is low contrast between he sign and the background [21].
Other tests realized with other point wise methods, for the obtainment of the threshold, gave the same results. The
principal advantages of these methods is it computacional velocity and it algorithmic simplicity.
3.2.2 Local technique
It is known that the local technique give better results that the point wise technique [14]. For that reason it was experienced with a supervised local algorithm, using in this case, in a first version, a training vector which components were the average and the variance; that say,
![]()
(1)
where ![]() ®
training vector and the average and variance were calculated according to the following
expressions:
®
training vector and the average and variance were calculated according to the following
expressions:
![]()
(2)
![]()
(3)
where f(i,j) is the intensity of the gray level in the pixel (i,j), W
is an odd number that denotes the broad of the mask and ![]()
The training sample was taken in the blood vessels for a 5x5 mask. The objects (blood vessels ) are classified according the following crierion:
if ![]()
If the pixel belongs to the object, of the contrary it is assigned to
the background. The value of î was taken in a "ad hoc" way and ![]() denotes module of the vector.
denotes module of the vector.
The vector ![]() is the one
which results of the difference between the training vector
is the one
which results of the difference between the training vector ![]() and the local vector
and the local vector ![]() that is formed in each piece with the movement of the mask; it means;
that is formed in each piece with the movement of the mask; it means;
![]() (4)
(4)
Each one of the components are normalized when is realized the subtraction of the vectors.
The result of this supervised method is shown in the figure 5. It can be observed, that, as opposed to the figure 4, the blood vessels are discriminated better, but some of them not are good definite ( see central part of the figure 5), beside they produce an increase of the perimeter of the vessels.
This method has, as a disadvantage, the fact of it consums much computacional time, which increases, as the components of the training vectors, the size of the mask and of the image, are increased. In occasions is not convenient to work with this method in an environment of PC.
Other of the local methods selected for to realize the segmentation was the Chiralo method, that operates of the
following form:
![]()
where m is the local average and g(x, y) is the exit image.This was proven with a 3x3 mask.
The result of to segment according to this algorithm is shown in the figure 6. It can be observed as the image remain with much noise, the blood vessels were not well discriminated in addition to consume computacional time. Of this result is deduces that the method does not good has behavior for images with low contrast (to see histogram of the figure 2).
Figure 6. Imagen segmented by the Chiralo method.
3.2.3 Point wise tehnique adapted to local.
Taking in consideration that the results, up until now obtained, were not satisfying the expectations concerning to
isolate adequately the blood vessels in a relatively rapid time, was experienced to combine the point wise methods with the locals ones, to avail the advantages that offer each one [14]. For that was divided the scene in chunks or contiguous zones of equal size, as is shown in the figure 7.
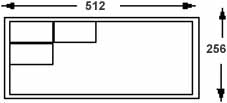
Figure 7. Subdivision of the image in contiguous windows.
This proceed permitted the obtainment of a most optimum threshold by each one of the windows. The size that were proven were: 32x16, 64x16, 64x32 and 128x64. With those sizes of window we experienced the following methods of automatic selection of the threshold:
- N. Otsu method.
- T. Punt method (first approximation) [11].
- T. Punt method (second approximation) [12].
- J. N. Kapur, P. K. Sahoo and A. K. C. Wong method [7]
- G. Johannsen and J. Bille method [6].
- Wen-Hsiang Tsai method [20].
Each one of these methods were proven for the diferents windows size, resulting the most adequate 64x16 window. Smaller size generates much noise, it means, information produced in any change of intensity of the background, and greater size, causes lost of important information. This can be verified in the figures 8, 9, 10 and 11, where is shown the obtained result using the Otsu method for 32x16, 64x16, 64x32 and 128x64 windows size respectively. It can be observed that for the 64x16 window the blood vessels can be observed and there is less noise than in the 32x16 window ( see figure 8). With the others sizes though is generated less noise, parts of the blood vessels are lost, mainly in the lower zone of the scene ( see figures 10 and 11). The same behavior was expressed for each one of the thresholding methods mentioned.
 |
 |
| Figure 8. Otsu method applied locally using a 32x16 window. |
Figure 9. Otsu method applied locally using a 64x16 window. |
 |
 |
| Figure 10. Otsu method applied locally using a 64x32 window |
Figure 11. Otsu method applied locally using a 128x64 window. |
When the adequate work window was selected, each one of the methods was studied separately, with the objective of choosing the most adequate for this type of images. In the figures 12, 13, 14, 15 and 16 is possible to appreciate the result of to segment through Pun (first and second approximation), Kapur and other, Johannsen and Bille, and Wen-Hsiang Tsaing respectively, for a 64x16 window size. It is observed that, in fact, the Otsu method ( see figure 9) is the most accurate. In the resulting images of the segmentation, unlike Otsu algorithm, for example, the Pun method (first and second approximation) generated much noise which is unfavorable for the post processing ( see figures 12 and 13), in the Kapur method the content of noise is smaller,but there are details distorted, furthermore, you can appreciate squares which correspond, justly, to the window size selected ( see figure 14). A similar analysis is valid for the Johannsen and Bille method ( see figure 15).
Figure 12. Pun method (first approximation). It can be observed the
generated noise.
For Wen-Hsiang method ( see figure 16), though was obtained a result very close to Otsu method for this image, it was not behaved thus for most of the scenes processed.
 |
 |
| Figure 13. Pun method (second approximation).
The generated noise is very seemed to the previous |
Figure 14. Kapur method. It is observed less noise, but are lost details. |
 |
 |
| Figure 15. Johansen and Bille method. It is
observed less noise, but are lost details. |
Figure 16. Wen-Hsiang Tsai method. |
Once be selected the segmentation method (Otsu), the following step was realize a post processing through median filter. It is known that the median filter [5] presents two fundamental advantages: it preserves the keenness of the edge and it is very efficient to smooth spike noise. Segmentation resulting image was filtered with 3x3 masks, or 1x3 and after 3x1. Masks size greater, for example 5x5, did not gave good results since were lost information of blood vessels. The result of that processing can be observed in the figure 17.
Figure 17. Post processed image with median filter.
All the process of filtering and segmentation is realized in seconds in a PC environment. Nevertheless, if it is observed carefully the figures 1 and 17 can be seen that, in fact, the blood vessels were well discriminated, but also there were classified other zones as blood vessels that correspond to brilliancy changes in the image background. This fact suggested that was necessary to continue the refining process of segmentation. For that reason it was experienced with other method proposed by Sharon [17], which suggests to obtain the threshold according to the following expression:
![]() (5)
(5)
where:
Media_vent ® pixels mean of the zone that is processed.
Desv_ruido ® pixels standard deviation of the background.
The image was split into equal 32x16 pieces since this window size was the optimum for the new algorithm. According to proposed by [17] if the standard deviation (SD) in the analysis zone is greater or equal to the SD of background pixels, then, the zone in question is segmented according to the threshold obtained by the expression (5). The result of to segment the scene of the figure 1 by this new algorithm is presented in the figure 18.
Figure 18. Segmented image according to Sharon method.
This is the integration of the three channels.
If we compare the result of the figure 18 with the one of the figure 9 it can be observed that, certainly, the blood vessels in both case were discriminated, but the image of the figure 18 is less noisy. The fact is that the threshold obtained by this new algorithm (see expression (5)) is representative of the objects in that zone, due to subtract the noise standard deviation to the zone average.
3.2.4 Segmentation in other spaces.
RGB color space is the most known and popular, however,according to some authors it presents some limitations,
being the principal, that the RGB space is more guided to the human visual system that to the machine [18]. Following this idea and as a manner of comparison is taked to experience, applying the last described method, in the HLS, YIQ and CMYK spaces. The result of the segmentation, for the HLS space, is shown in the figure 19.
Figure 19. Segmented image in the HLS space.
After observing this image and after comparing it with the one of the figure 18, though is obtained a very similar result respect to the discrimination of the blood vessels, it can be observed that the noise is a little higher. Moreover, the calculation time increases because it is necesary to realize a transformation to other spaces. Similar results were obtained for the others spaces.
Taking in consideration that RGB space got, as arule, the better results, and with the objective of to know how each channel contribute in the segmentation process, we passed to study the image by each one of them. Then was applied the procedure of segmentation proposed by [17] with a32x16 window size. The result of this processing is shown inthe figures 20, 21 and 22 respectively.
 |
 |
| Figure 20. Resulting image of the segmentation
in the red channel. |
Figure 21. Resulting image of the segmentation
in the green channel. |
 |
Figure 22. Resulting imagen of the segmentation in the blue channel. |
It can be observed in the image of the figure 20 the great quantity of noise that is generated in the red channel, it is sign that this channel only has a little contribution in the process of segmentation and generates fundamentally a lot of noise. In the blue channel (see figure 22) it is not generatedas much noise as in the red, but it is created some zones as blood vessels as in reality its are not. This can be seen, after comparing the figure 22 (central part of the image) with the figure 1. However, the segmentation result in the green channel (see figure 21) is better respect to the red and to the blue channel. For one part is not generated so much noise and by other not create zones, as a rule, wrong classified. If it is compared the result of the segmentation by the green channel (see figure 21) with the one of the figure 18, the which is the three channels integration, it is observed that in both cases the blood vessels are well discriminated with the little difference that the segmentation by the green channel generates a little more of pepper noise, which we can attenuate through median filter. An important aspect to emphasize in the segmented image by the green channel is that the blood vessels are more reinforced when we compare them with the image obtained by the three channels integration (see figure 18). This algorithm had this behavior through out all the analyzed images, and took us to realize the processing according to the scheme of the figure 23.
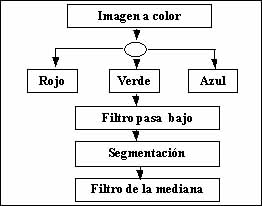
Figure 23. Representative scheme of the steps in
the
segmentation process through of green channel.
With this result has been obtained a processing strategy, which is simple, fast and robust in a PC environment.
Once the image has been filtered after the segmentation with the median (see figure 24) it is prepared for a subsequent processing through etiquettes [15] and the use of mathematical morphology [9] to obtain the final image that is presented to the pathologist. These results will be the aims of next publications.
Figure 24. Resulting imagen of the
segmentation in
the green channel and filtered by the median.
As other example are presented in the figures 25 and 26 the original image (of a angiogenesis process) and the segmentation obtained following the strategy that is shown in the figure 23. It can be seen as the blood vessels are well isolated (see figure 26), what show the effective of the method.
 |
 |
| Figure 25. Malign tumors of soft parts (ABC, CD34, x200). |
Figure 26. Segmented image through green channel. |
In the paper is presented a study of differences segmentation procedures with the objective of isolating blood vessels in a angiogenesis process, all this in a personal computer environment. We concluded that according to the problems to solve and to the departure image, the heuristic combination of point wise methods with local is more adequate for the obtainment of a rapid and effective algorithm. Of all the experienced methods, the one which give the best results for this application, it was proposed by [17]. We worked in other spaces, as the HLS, YIQ and CMYK, resulting adequate for these images the RGB. We realized a study for the red channel, the green and blue, is concluded that the red channel is the more moisy and the green gives greater information quantity. In this sense is offered a processing strategy, which is simple, rapid and robust to be executed in a PC environment.
Next results will be published, with the utilization of the etiquettes and the use of mathematical morphology as a post processing once the images have been segmented.
The authors would like to thank professor Antonio Llombart Bosch, Director of Department of Pathology, Faculty of Medicine, Valencia University, Spain for facility offered in the realization of the inmunohistochemical techinical.
- Boschner, B. H., Cote, R. J., Weidner, N., Groshen, S., Chen, S. C., Skinner, D. G., Nichols, P. W.: Angiogenesis in bladder cancer: relationship between microvessel density and tumor prognosis, J. Natl. Cancer Inst., 87: 21, no.1, 1603-1612, 1995.
- Chiralo, R. P. y Berdan, L. L.: Adaptive digital enhancement of latent fingerprints, Proc. of IEEE, vol.20, 1985.
- Díaz-Flores, L. , Gutiérrez, R., Varela, H. : Angiogenesis: an update, Histol Histopath 9: 807-843, 1994.
- González, R., Woods, R. E., Rodríguez, D. F., Rosso, L., Ruíz, S. y Joyanes, A. L.: Tratamiento Digital de Imágenes, Addison-Wesley Iberoamericana, S.A, Imington, Deleware, EUA., 1996.
- Huang, T. S., Yang, G. J., Tang, G. Y.: A fast two-dimensional median filtering algorithm, IEEE Transactions on Acoustics, Speech, and Signal Proccesing, vol. ASSP-27, no.1, 13-18,1979.
- Johannsen, G., Bille, J.: A threshold selection method using information measures, Proceeding 6Th Int. Conf. Pattern Recognition, Munich, Germany, 140-143, 1982.
- Kapur, J. N., Sahoo, P. K., Wong, A. K. C.: A new method for gray level picture thresholding using the entropy of the histogram, Comput. Graphics Image Process. 29, 273-277, 1985.
- León, S. P., Folkerth, R. D., Black, P. M.: Microvessel density is a prognostic indicator for patients with astroglial brain tumors, Cancer, 77: 2, no.15, 362-372, 1996.
- Maragos, P., Schafer, R. W.: Morphological Systems for Multidimensional Signal Processing, Proceedings of the IEEE, vol. 78, no. 4, 1990.
- Otsu, N.: A threshold selection method from gray level histogram, IEEE Trans. Systems Man Cybernet , SMC-8, 62-66, 1978.
- Pun,T.: A new method for gray level picture thresholding using the entropy of the histogram, Signal Processing 2, 223-237, 1980.
- Pun, T.: Entropic thresholding: A new Approach, Comput. Graphisc Image Process. 16, 210-239, 1981.
- Rodríguez, M. R., Fernández-Britto, J.E., Navarro, R. W., Campos, R. : MADIP, Morfometría Analítica y Digitalización en Patología: Software para el diagnóstico e investigación en Patología, Rev. Cubana de Invest. Biomed. 11(2):126-128, 1992.
- Rodríguez, M. R..: La interacción y el conocimiento heurístico en la restauración y el mejoramiento de imagen. Un sistema inteligente (SIPDI). ( Tesis de PhD.), ISPJAE, Habana, Cuba, 1995.
- Rosenfeld A., Kak, A. : Digital Picture Processing, Academic Press, Inc., New York, 1976.
- Semple, J. P, Welch, W. R., Folkman, J.: Tumor angiogenesis and metastasis - correlation in invasive breast carcinoma, N. Engl. J. Med. 324: 1-8, 1991.
- Sharon, A. S.: ANGY: A rule-Based Expert System for Automatic Segmentation of Coronary Vessels From Digital Substrated Angiograms, IEEE Transactions on pattern Analysis and Machine Intelligence, vol. PAMI 8, No. 2, 188-199, 1986.
- Valavanis, K. P., Zheng, J. and Paschos, G.: A total Color Difference Measure for Segmentation in Color Images, Journal of Intelligence and Robotic Systems 16: 269-313, 1996.
- Weidner N., Carroll, P. R., Flax, J., Blumenfeld, W., Folkman, J.: Tumor angiogenesis correlates with metastasis in invasive prostate carcinoma, American Journal of Pathology, vol. 143, no.2, 1993.
- Wen-Hsiang Tsai: Moment-Preserving Thresholding: A new approach, Comput. Graphics Image Process. 29, 377-393, 1985.
- Wu, K., Gauthier, D. and Levine, M.D: Live Cell Image Segmentation, IEEE Transactions on Biomedical Engineering, vol. 42, no. 1, 1995.
- Zheng, J., Valavanis, K. P and Gauch, J. M: Noise Removal from Color Images, Journal
of Intelligence and Robotic Systems 7:257-285, 1993.