(C) Authors hold the copyright on their poster.
| INABIS '98 Home Page | Your Poster Session | Related Symposia & Posters | Plenary Sessions | Exhibitors' Foyer | Personal Itinerary | New Search |
Cohort studies on the effect of lifestyle on survival have been reported initially in the United States (Haynes 1980, Berkman 1983) and these results have been quoted for health promotion plan in Japan. As there are many differences on the lifestyles of the Japanese and western people, the results of these reports do not always apply for the Japanese. An attempt was made focusing on health practices in Japan (Kawada 1994).
Aoki et al. (1995) conducted a historical cohort study of inhabitants using health examination data. In their research, age in years at baseline, diastolic blood pressure and smoking were good predictors of survival in men, while in women, age in years at baseline, diastolic blood pressure and body mass index were good predictors of survival. Nevertheless, because of the methodological problem, this research was limited in variables, and it is recommended a prospective cohort study to clarify risk factors on survival.
In this report, the authors conducted a cohort study targeting inhabitants living towns or villages, and health risk appraisal on health habits and health examination outcome was made.
Table 1. Questionnaire on health practices
| Name of city, town, or village______________ | ID number______________ |
| 1. Do you exercise regularly (2 or more times a week)? | Yes, No |
| 2. Do you drink 6 times or more per week? | Yes, No |
| 3. Do you smoke? | Yes, No, Quitted |
| 4. How many hours do you sleep? | 5, 6, 7, 8, 9 |
| 5. Do you eat breakfast everyday? | Yes, No |
| 6. Do you eat snack everyday? | Yes, No |
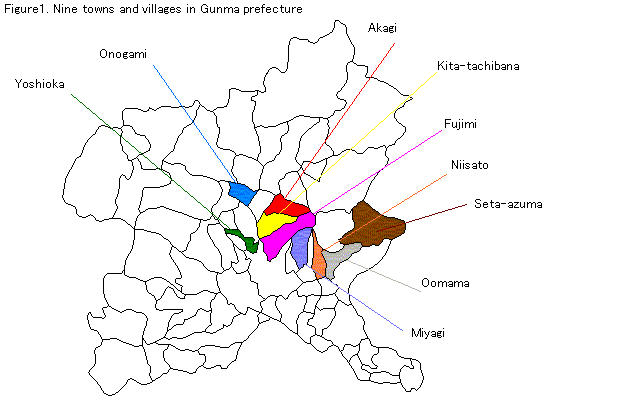
Their age ranged from 40 to 60 years old. From 28,830 subjects who responded to the short-form questionnaire, 8,410 subjects lives in the following 9 towns or villages. Those were Omama, Yoshioka, Niisato, Miyagi, Akagi, Onogami, Kita-tachibana. Seta-azuma, and Fujimi (Figure 1).
The response rate against the number of participation was 84.5 percent and that against the number of target population was 62.3%. Death certificates of inhabitants in these 9 towns or villages have been continuously checked in the health center according to the formal procedure of Management and Coordination Agency (permission for extraordinary use coded as No. 224). Subjects who did not answer 6 questions perfectly or did not check their blood or urine were excluded, and a total of 7,694 fixed subjects (2,555 men and 5,139 women) were defined. Thus the response rate against the number of participation was 77.3% and that against the number of target population was 57.0%.
In addition to the short-form questionnaire, the analysis also utilized health examination data such as sex, age in years at baseline, systolic and diastolic blood pressure (SBP, DBP), stature, weight, serum creatinine (CRE), glutamic oxaloacetic transaminase (GOT), glutamic pyruvic transaminase (GPT), Gamma-glutamyl transpeptidase (Gamma-GTP), total cholesterol (CHOL), high density lipoprotein cholesterol(HDLC), and urinalysis were used for the analysis.
Body mass index (BMI), which is calculated as weight (Kg)/the square of stature (m), was adopted as the obesity index. Atherogenic index (AI) was calculated by which (CHOL-HDLC) was divided by HDLC. Good health practices were scored 1 according to the following criteria, i.e. not smoking including quitting, not drinking or drinking less than six days per week, exercise more than one day per week, BMI from 20 to 28, total night sleeping time between six and nine hours, eating breakfast everyday, and not taking snack everyday. Other practices not applied to these criteria were scored as 0. All quantified data were summed up as the health practices index (HPI7) (Table 2).
Table 2. Classification of health practices in 9 towns' study
| Variables | Categories | Remarks |
| Physical activity (1,0) | Active, inactive | based on the frequency (2>= per week or not) |
| Smoking status (1,0) | Never or quitting, currently smoking | Cigarettes |
| Obesity status (1,0) | Average (BMI=20 to 28), under or over | Body mass index was expressed by Quetelet Index (weight in kg/(height in m)^2) |
| Alcohol consumption (1,0) | <=5 times/week, >= 6times/week | Based on frequency of drinking |
| Sleeping pattern (1,0) | 7 or 8 hrs/night, 6<= or 9>= hrs/night | Based on usual number of hours slept per night |
| Eating breakfast (1,0) | Everyday, Not everyday | |
| Snacking (1,0) | Not everyday, Everyday | |
| Health Practices Index (0-7) | Summing up of the number of good (low-risk) health practices | |
It was examined whether there was a difference in the ratio and the mean value according to survival information stratified by sex. Fisher's exact test and Mann-Whitney U test were used for statistical analysis. To analyze the risk factor on survival, Cox proportional hazard regression analysis was used (Cox 1984). The statistical analyses were performed using SPSS for windows Ver. 6.1.3 (SPSS Inc. IL, USA).
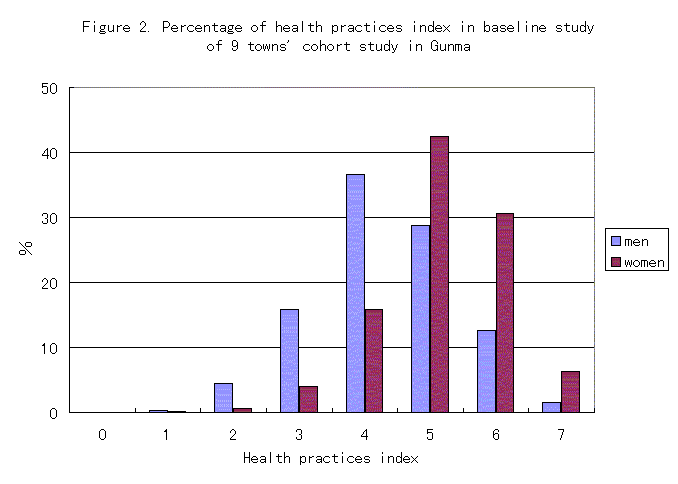
There was an upward shift in the distribution of HPI7 of women compared with that of men, mainly due to the differences in smoking, drinking and snacking habits.
1. Difference in the mean value of each factor by survival information
1) Men
Table 3 shows the mean and standard deviation of each factor by survival information. The mean value of triglyceride of the dead group in men was significantly lower than that of alive ones (p<0.01). The mean values of BMI, creatinine, GOT, GPT, Gamma-GTP of the dead group in men were significantly lower than those of alive ones (p<0.05).
There was no association between positive percentage of urinalysis (proteinuria, glucosuria, occult blood in urine) and death.
Table 3. Mean and standard deviation of each indicator in men stratified by survival information
| Number of case | alive | dead | |
| Variable | (Alive, Dead) | Mean +/- SD | Mean +/- SD |
| KAGE | (2,519, 36) | 49.86 +/- 6.16 | 51.8 +/- 6.46 |
| HPI7 | (2,519, 36) | 4.3 +/- 1.09 | 4.3 +/- 1.02 |
| BMI | (2,519, 36) | 23.06 +/- 2.764 | 22.29 +/- 3.458* |
| SBP | (2,518, 36) | 134.2 +/- 16.55 | 134.6 +/- 22.58 |
| DBP | (2,518, 36) | 80.4 +/- 10.53 | 80.6 +/- 13.00 |
| CRE | (2,513, 36) | 1.04 +/- .144 | 1.00 +/- .103* |
| GOT | (2,513, 36) | 25.8 +/- 27.38 | 23.8 +/- 14.74* |
| GPT | (2,513, 36) | 25.7 +/- 33.25 | 20.6 +/- 14.94* |
| Gamma-GTP | (2,513, 36) | 40.8 +/- 54.76 | 35.0 +/- 62.49* |
| CHOL | (2,513, 36) | 194.1 +/- 35.02 | 185.1 +/- 39.36 |
| HDLC | (2,513, 36) | 44.62 +/- 12.649 | 43.19 +/- 10.320 |
| TRIGLY | (2,513, 36) | 186.1 +/- 142.74 | 128.5 +/- 69.37** |
| AI | (2,513, 36) | 3.70 +/- 1.616 | 3.56 +/- 1.596 |
2) Women
Table 4 shows the mean and standard deviation of each factor by survival information. The mean values of age in years at baseline (p<0.01), DBP (p<0.05), GOT (p<0.01), GPT (p<0.05), Gamma-GTP (p<0.05) and triglyceride (p<0.05) were significantly higher than those of alive group.
There was no association between positive percentage of glucosuria or occult blood in urine and death, but there was a significant relationship between proteinuria and death (p<0.05). Positive percentage of proteinuria was 3.8% (2/52) in dead group and 0.5% (26/5027) in alive group.
Table 4. Mean and standard deviation of each indicator in women stratified by survival information
| Number of case | alive | dead | |
| Variable | (Alive, Dead) | Mean +/- SD | Mean +/- SD |
| KAGE | (5,111, 28) | 49.64 +/- 6.17 | 54.68 +/- 5.84** |
| HPI7 | (5,111, 28) | 5.2 +/- .97 | 5.2 +/- .86 |
| BMI | (5,111, 28) | 23.14 +/- 2.986 | 24.92 +/- 6.520 |
| SBP | (5,108, 28) | 128.3 +/- 17.01 | 136.2 +/- 23.45 |
| DBP | (5,108, 28) | 75.1 +/- 10.30 | 79.9 +/- 12.71* |
| CRE | (5,102, 27) | .85 +/- .149 | .80 +/- .136 |
| GOT | (5,102, 27) | 20.0 +/- 8.08 | 34.2 +/- 37.14** |
| GPT | (5,101, 27) | 16.5 +/- 11.57 | 26.9 +/- 23.57* |
| Gamma-GTP | (5,102, 27) | 15.2 +/- 16.92 | 34.3 +/- 44.85* |
| CHOL | (5,091, 27) | 201.5 +/- 35.43 | 208.5 +/- 43.75 |
| HDLC | (5,091, 27) | 48.41 +/- 11.488 | 47.70 +/- 13.237 |
| TRIGLY | (5,091, 27) | 141.9 +/- 91.61 | 174.5 +/- 97.89* |
| AI | (5,091, 27) | 3.39 +/- 1.304 | 3.81 +/- 2.188 |
2. Analysis of the health hazard by Cox proportional hazard regression analysis
Since sex difference was recognized for the risk factor of death, analysis was then made separately by gender. Variables were age in years at baseline and HPI7 both in men and women. BMI and creatinine were included in men, and DBP was included in women. GPT, Gamma-GTP and triglyceride were included both in men and women. These values were selected from the result of univariate analysis considering multicollinearity, and then each health practice and age in years at baseline were used to check contribution of survival.
1) Men
It has been understood that triglyceride was significantly contributed to the risk of death (Table 5). HPI7, which meant good health habits if its score became higher, showed no tendency of high risk of death. When triglyceride of subject became 10 mg/dl higher, the RR (95%CI) was 0.941 (0.892-0.992).
There were no significant factors of seven health practices on survival (Table 6).
Table 5. Relative risk and 95 % confidence interval of each variable by Cox proportional hazard regression analysis
| Men | Women | |||
| Variable | RR | 95% CI | RR | 95% CI |
| KAGE | 1.04 | 0.989-1.102 | 1.146** | 1.060-1.239 |
| HPI7 | 1.01 | 0.738-1.372 | 0.970 | 0.657-1.432 |
| BMI | 0.997 | 0.865-1.150 | ||
| DBP | 1.03 | 0.998-1.072 | ||
| CRE | 0.187 | 0.016-2.202 | ||
| GPT | 0.988 | 0.958-1.020 | 1.01* | 1.000-1.027 |
| Gamma-GTP | 1.00 | 0.994-1.009 | 1.01* | 1.001-1.012 |
| TRIGLY | 0.994* | 0.989-0.999 | 1.00 | 0.998-1.003 |
Table 6. Relative risk and 95% confidence interval of each health practice and age in years at baseline by Cox proportional hazard regression analysis
| Men | Women | |||
| Variable | RR | 95% CI | RR | 95% CI |
| KAGE | 1.05 | 0.994-1.111 | 1.15** | 1.073-1.242 |
| ALCOHOL | 1.52 | 0.777-2.963 | 1.04 | 0.292-3.727 |
| TOBACCO | 0.640 | 0.310-1.320 | 0.263** | 0.100-0.690 |
| EXERCISE | 1.03 | 0.427-2.488 | 2.32* | 1.083-4.977 |
| BMI | 0.634 | 0.295-1.361 | 0.527 | 0.238-1.168 |
| SLEEP | 1.00 | 0.239-4.216 | 0.752 | 0.225-2.515 |
| BREAKFAST | 0.998 | 0.298-3.343 | -- | -- |
| SNACK | 0.959 | 0.446-2.061 | 1.61 | 0.738-3.499 |
2) Women
Age, GPT and Gamma-GTP significantly contributed to the risk of death (Table 5). When the subject became 10 years older, the RR (95%CI) was 3.91 (1.80-8.51). When GPT of subject became 10 mg/dl higher, the RR (95%CI) was 1.15 (1.00-1.31). When Gamma-GTP of subject became 10 mg/dl higher, the RR (95%CI) was 1.07 (1.01-1.13).
Age in years at baseline, no-smoking and exercise were significantly associated with survival (Table 6). When subject became 10 years older, the RR (95%CI) becomes 4.19 (2.01-8.72).
There are some problems in this study. 1) Adjustment variables such as socioeconomic status, use of preventive health services, life satisfaction, physical health status and social network could not be included. 2) Since the target subjects were participants of health examination, healthy-subjects effect may also exist. 3) Cause of specific mortality could not be checked by the limitation of sample size. 4) Endpoint of moved-out subjects was assumed to be the same with other subjects. These problems are difficult to solve in this study.
In this study, about half of the death was caused by cancer. This is almost the same with death of female in Japan (Ministry of Health and Welfare, 1996). Health examination was intended to prevent cardiovascular and heart disease, not intended for cancer screening. Health habits were also not specified for cancer, and these may be of influence on the results, especially on men. Furthermore, the number of decease was only 64 and variables for multivariate analysis were limited (Ohashi Y and Hamada C, 1995).
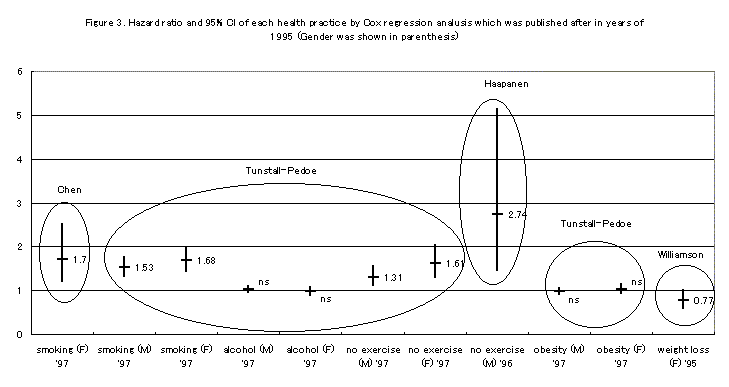
Smoking contributes many sorts of cancer (U.S. Department of Health and Human Services 1982; Ministry of Health and Welfare 1993). Cessation of smoking and drinking made standardized mortality ratio (SMR) of cancer death to be 81 (65-74 with 95% confidence interval) (Kjaerheim et al., 1993). They concluded that this healthy custom is assumed to decrease the cancer. Davis et al (1994) reported that current smoking in men and women, and inappropriate body mass index (under 22 or over 30) in women predict survival time for middle-aged subjects (45-54 years old), and the effect of specific behavior on survival may vary by age and gender. Chen et al (1997) calculated relative risk of female current smoker against non-smoker to be 1.7 (1.2-2.5 with 95% CI). Tunstall-Pedoe et al (1997) also made a risk assessment of smoking, and the RR (95% CI) were 1.53 (1.33-1.75) in men and 1.68 (1.43-1.99) in women by Cox proportional hazard regression analysis. Smoking is a significant contributing factor on survival. In contrast, the same authors described RR of drinking to be 1.02 (0.95-1.1) in men and 0.97 (0.8-1.07) in women, expressing no significance. As the dose-response relationship between alcohol consumption and survival does not become linear but J, U, or L shaped relationship (Thun et al., 1997), RR against no drinking might not become significant. In this report, smoking was checked by combination of health examination data. Smoking habit was included in Breslow's seven health practices, and each health practice was summed up or separately used in this study. There was a significant contribution of no-smoking on survival in women. But desirable act such as exercise increased the risk of death in women. As it spent relatively short period from the baseline study, deceased subjects already had a factor of disease, and conducting a good health practice might contribute in this result. After the follow-up for a longer period, a re-analysis should also be conducted.
Filipovsky et al (1993) showed that the risk ratio of person with not more than 24.4 of BMI or with no less than 96 mmHg of mean blood pressure was significantly high for total, cancer and cardiovascular death. Low BMI became risk factor for survival, which is consistent to our past historical cohort study (Aoki et al, 1995). Tunstall-Pedoe et al (1997) reported RR (95% CI) of physical inactive in work against active subjects to be 1.26 (1.09-1.45) in men and 1.54 (1.22-1.94) in women. Physical inactive in leisure time against active subjects showed RR to be 1.31 (1.11-1.54) in men and 1.61 (1.29-2.02) in women. Haapanen et al (1996) reported RR (95% CI) to be 2.74 (1.46-5.14). In contrast, overweight expressed by BMI showed no significant contribution on survival (Tunstall-Pedoe et al., 1997), except for preventive effect on survival of loss in weight within short period (Williamson et al., 1995). They described RR (95% CI) to be 0.77 (0.59-1), when over 9.1kg reduction was succeeded within one year. Practicing exercise program or achievement for loss in weight is effective for prevention, but baseline data of obesity contributed little on survival. Fraser et al (1997) also reported that obesity was not associated with mortality after excluding baseline information. Furthermore, Tunstall-Pedoe et al (1997) reported blood pressure to be a significant contributing factor on survival not only cardiovascular death but also all-caused death. Diastolic blood pressure in the present result, in contrast to our historical cohort study (Aoki et al., 1995), showed no significant for all-cause of death. Data on blood specimen such as CHOL and HDLC contributed little on survival in this report, which is in accordance with the past report (Tunstall-Pedoe et al., 1997).
Berkman LF, Breslow L. Health and Ways of Living. The Alameda County Study. New York: Oxford University Press, p161-75, 1983.
Cox DR, Oakes DO. Analysis of Survival Data. Monographs on Statistics and Applied Probability, No.21, Chapman & Hall, p91-111, 1984.
Chen ZM, Xu Z, Collins R, Li WX, Peto R. Early health effects of the emerging tobacco epidemic in China. A 16-year prospective study. JAMA 1997;278:1500-4.
Davis MA, Neuhaus JM, Moritz DJ, Lein D, Barclay JD, Murphy SP. Health behaviors and survival among middle-aged and older men and women in the NHANES I Epidemiologic Follow-up Study. Prev Med 1994;23:369-76.
Filipovsky J, Ducimetiere P, Darne B, Richard JL. Abdominal body mass distribution and elevated blood pressure are associated with increased risk of death from cardiovascular diseases and cancer in middle-aged men. The results of a 15- to 20-year follow-up in the Paris prospective study I. Int J Obes Relat Metab Disord 1993;17:197-203.
Fraser GE, Sumbureru D, Pribis P, Neil RL, Frankson MA. Association among health habits, risk factors, and all-cause mortality in a black California population. Epidemiology 1997;8:168-74.
Haapanen N, Miilunpalo S, Vuori I, Oja P, Pasanen M. Characteristics of leisure time physical activity associated with decreased risk of premature all-cause and cardiovascular disease mortality in middle-aged men. Am J Epidemiol 1996;143:870-80.
Haynes SG, Feinleib M, Kannel WB. The relationship of psychosocial factors to coronary heart disease in the Framingham Study. III. Eight-year incidence of coronary heart disease. Am J Epidemiol 1980;111:37-58.
Kawada T, Shinmyo RR, Suzuki S. Effects of regular health practices on subjective evaluation of health. Sangyo Igaku 1994;36:57-63.
Kjaerheim K, Andersen A, Helseth A. Alcohol abstainers: a low-risk group for cancer--a cohort study of Norwegian teetotalers. Cancer Epidemiol Biomarkers Prev 1993;2:93-7.
Ministry of Health and Welfare. Smoking and Health (Kitsuen to Kenkou), Tokyo: Hoken Dojinsha, 1993.
Ministry of Health and Welfare. Health and Welfare Statistics in Japan, Tokyo: Health and Welfare Statistics Association, p52, 1996.
Ohashi Y and Hamada C. Analysis of Survival Data. Tokyo: University of Tokyo Press, p107, 1995 (in Japanese).
Thun MJ, Peto R, Lopez AD, Monaco JH, Henley SJ, Heath CW Jr, Doll R. Alcohol consumption and mortality among middle-aged and elderly U.S. adults. N Engl J Med 1997;337:1705-14.
Tunstall-Pedoe H, Woodward M, Tavendale R, A'Brook R, McCluskey MK. Comparison of the prediction by 27 different factors of coronary heart disease and death in men and women of the Scottish Heart Health Study: cohort study. BMJ 1997;315:722-9.
U.S. Department of Health and Human Services. The health Consequences of Smoking. A report of the Surgeon General. Rockville: U.S. Department of Health and Human Services, 1982
Williamson DF, Pamuk E, Thun M, Flanders D, Byers T, Heath C. Prospective study of intentional weight loss and mortality in never-smoking overweight US white women aged 40-64 years Am J Epidemiol 1995;141:1128-41.