Invited Symposium: Molecular Mechanisms of Ageing
| INABIS '98 Home Page | Your Session | Symposia & Poster Sessions | Plenary Sessions | Exhibitors' Foyer | Personal Itinerary | New Search |
Introduction
The culture of normal human diploid fibroblasts has been used as a model of replicative cell aging for basic researches in the field of gerontology, because the normal cells show the limited life span in vitro. In fact, the human diploid fibroblast line TIG-3 established in our institute cannot continue replication over the finite life span around 70-80 population doubling levels (PDL), even in any optimized culture condition unless they are immortalized. The replicative senescence of normal human diploid fibroblasts was first described by Hayflick and Moorhead [1,2]. The cellular senescence in culture was proposed to reflect processes that occur in organismic aging in vivo. However, the molecular mechanism responsible for the cellular senescence is still poorly understood. The shortening of telomere has been proposed as the most probable mechanism of the cellular senescence by Harley et al. [3], but not all phenotypes of the senescent cells could not be ascribed to the shortening of telomere.
2-D PAGE [4,5] is the most powerful technique to analyze protein alterations in various physiological conditions of cells. Celis and his co-workers [6] reported their 2-D gel protein database of MRC-5 human embryonal lung fibroblast, that was applied to the quantitative identification of polypeptides whose relative abundance differed between quiescent, proliferating and SV40-transformed cells [7]. However, the database contained no data about the protein variation during the cellular aging. Thus, we established our own 2-D gel protein database from which data of age-dependent protein variation were retrievable. The clickable spot protein map was prepared from silver-stained 2-D gel images. The data of relative abundance of proteins were linked to the map. In this paper, we report the structure and function of the TMIG-2DPAGE protein database.
Materials and Methods
Materials
Immobiline DryStrip and Pharmalyte were purchased from Pharmacia (Uppsala, Sweden). Tris, Tricine, SDS, Triton X-100 were from Sigma (St. Louis, MO, USA). pI and Mr marker proteins were obtained from Daiich Pure Chemicals (Tokyo, Japan). Silicon oil KF-96L-5c/s was a product of Shin-Etsu Chemical Co. (Tokyo, Japan). A silver stain kit 299-23841 and other chemicals of reagent grade were purchased from Wako Pure Chemicals (Osaka, Japan). A COOL PHOR horizontal electrophoresis apparatus Model 3600, a vertical slab electrophoresis apparatus and a programmable power supply model 3800 were from Anatech (Tokyo, Japan). The PDQUEST software package was from PDI (Huntington Station, NY, USA).
Cells and culture condition
TIG-3 human fetal lung diploid fibroblasts line established in our institute [8] was employed in the research on cellular aging. The cell line had been confirmed free from mycoplasma contamination [9]. The karyotype of the cell line was analyzed by Matsuo et al. [10]. The cells were serially subcultivated in Eagle’s basal medium (BME, GIBCO) supplemented with 10% fetal bovine serum (FBS) by a standard method of 1:4 splitting throughout the in vitro life-span. The cell line showed the replicative senescence around 76-80 PDL in the culture condition. Human skin fibroblasts were isolated from forearms of healthy volunteers and subcultivated for several passages before 2-D gel analysis.
Protein samples
Cells at various PDLs were grown to a 70-80% confluence on 6 cm i.d. dishes. After rinsing with phosphate-bufferred saline, cells were harvested by scraping with a plastic scraper. The cell suspension was transferred to a microfuge tube, and supplemented with urea (8 M), 2-ME (3%), SDS (0.02%) and Triton X-100 (0.1% in final concentration). Cells were disrupted by ultra-sonication, and the supernatant was removed by centrifugation.
2-D gel electrophoresis
2-D gel electrophoresis was performed according to the protocol reported in our previous paper [11]. In brief, the first-dimensional isoelectric focusing was carried out on an Immobiline DryStrip (18 cm long, pH range 4-7). After focusing, the gel strip was incubated in the SDS-treatment solution (50 mM Tris-HCl, pH 6.8, 6 M urea, 0.5%(w/v) dithiothreitol, 2%(w/v) SDS, 0.005%(w/v) BPB, 25%(v/v) glycerol) with gentle shaking at room temperature for 40 min. The gel strip was put on the top of a gel slab, and pressed with a shark-teeth-shaped comb to achieve firm contact between the strip and the gel slab. The second-dimensional SDS-PAGE was performed on a 7.5%T, 3%C polyacrylamide gel slab (20 x 18 cm) in a vertical electrophoresis apparatus using a Tris-tricine buffer (0.1 M Tris, 0.1 M tricine, 0.1%(w/v) SDS) for electrolytes in the cathodic electrode vessel.
Proteins within the range of pI 4.5-6.7 and 10-200 kDa were resolved in the 2-D gel that was run in the above condition. Proteins out of the range will be analyzed using another gel strip of alkaline pH gradient to supplement the protein database.
Protein staining and 2-D gel image analysis
Protein spots were visualized using a Wako silver stain kit 299-23841, with which the highest linearity in optical density of spots was achieved among commercially available kits tested. The silver-stained 2-D gel images were acquired with a SUN SPARC station through the SHARP 330 desk-top scanner. Spot detection, matching and quantitation were performed on the workstation installed with the PDQUEST 2-D gel image analysis software. Data of relative abundance of individual spot proteins were obtained from the IOD data by calculation as percentage in the total IOD of all spots on the gel. The molecular mass and pI of spot proteins were also determined with the PDQUEST software by giving standard values of marker proteins which were separated simultaneously in a same gel.
WWW home page and TMIG-2DPAGE protein database
The WWW home page (http://www.tmig.or.jp/2D/) was prepared on another SUN SPARC Station that was placed out of the "fire wall" in our institute. The workstation was installed with a NCSA httpd and imagemap cgi to achieve the linkage of spots on the map to the individual data entry by simple mouse clicking. Data of PDL-dependent protein variation were entered into the file of TMIG-2DPAGE protein database that was prepared according to guidelines for building a federated 2-D gel protein database recommended by Appel et al. [12].
Results
PDL-dependent protein variation in human diploid fibroblasts
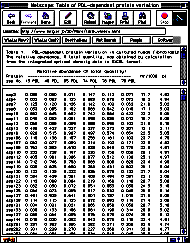
Cellular proteins extracted from TIG-3 human diploid fibroblasts at 15, 40, 65, 74, 76 and 78 PDL were resolved by 2-D PAGE, and IODs of 467 spot proteins detected by silver staining were quantitated using the PDQUEST system. Relative abundances of individual spot proteins of cells at various PDLs were determined from a set of 2-D gel patterns which were run simultaneously. The 2-D PAGE analysis was repeated three times, and the average values of the relative abundances of individual spots were saved in a file of data for preparation of the protein database. Data of molecular mass and pI were also merged into the file. The file of the data was finally up-loaded to the WWW server computer. Fig. 1 shows the partial view of the data in a table form that was accessed by Netscape Navigator though the Internet.
 Click to enlarge
Fig. 1: A partial view of the data of PDL-dependent protein variation in a table form. The data can be accessed through the Internet using a browser such as Netscape Navigator. All the data can be seen by scrolling the table.
The PDL-dependent variations of spot protein quantity in normal human diploid fibroblasts were classified into 5 categories. That is, increase (I), decrease (D), increase followed by decrease (I/D), decrease followed by increase (D/I), and irregular or non-significant variation (-).
Clickable 2-D gel image of human diploid fibroblasts
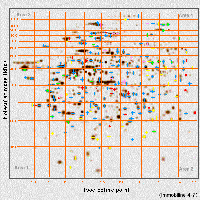
The 2-D gel protein database TMIG-2DPAGE was prepared with protein data entries of PDL-dependent variation in accordance with most of rules recommended by Appel et al. [12]. To achieve the accessibility of individual data entries by a simple mouse click on the corresponding 2-D gel spot, a clickable 2–D gel image was prepared from silver-stained 2-D gel patterns of lung and skin fibroblasts (Fig. 2).
 Click to enlarge
Fig. 2: Clickable 2-D gel image of a human diploid fibroblast cell line TIG–3. The image was prepared from silver-stained 2-D gel patterns. Colored symbols with red, green, yellow, pink and blue indicate increase, decrease, increase followed by decrease, decrease followed by increase and non-significant fluctuation in their relative abundance of spot proteins during aging, respectively. The individual data entry is retrievable by a simple mouse click on the spot with cross symbols.
Spots on the clickable 2-D gel image, to which individual data entries were linked, were marked with colored cross symbols (Fig. 2). Red, green, yellow, pink and blue colors indicate increase, decrease, increase followed by decrease, decrease followed by increase, and irregular or non-significant variation during in vitro aging, respectively.
Individual data entry of each spot protein.
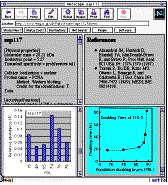
Individual data entries which were linked to the clickable 2-D gel image are displayed in a frame with 4 windows as shown in Fig. 3.
 Click to enlarge
Fig. 3: An example of the individual data entry that was retrieved by mouse click on the corresponding spot on the clickable 2-D gel image. The physico-chemical properties, information about the spot identity, and link to the related database in the Internet network are shown in the upper-left window. References of papers that dealt with the spot proteins are cited in the upper-right window. Details of the age-related alteration of its relative abundance during aging is displayed in the lower-left window. Other miscellaneous information such as cell property are included in the lower-right window.
The ssp number, the physical property, activities or functions, URL linkage for hypertext cross-references to related databases in the Internet appear in the upper-left window. The list of bibliographic references of the protein are presented in the upper-right window. The graphic plot of the PDL-dependent variation of the protein is displayed in the lower-left window. The lower-right window is used to show miscellaneous information about the protein. The TMIG-2DPAGE protein database is now open to access in our WWW home page at URL of http://www.tmig.or.jp/2D/.
Discussion and Conclusion
A preparation of 2-D gel protein database with quantitated spot data of cellular proteins was first reported by Celis et al. [6], in which they compared normal and immortalized fibroblasts. Their database has been very useful for analyzing molecular mechanisms of cell proliferation. However, they might not intended to apply the database for researches on cellular aging. In this paper, we reported the establishment of a new concept of protein database that contains data of protein variation during in vitro aging of normal cells. Culture of TIG-3 was used in this study as a model system for analyzing protein variation during cellular aging because the replicative senescence of the established cell line had been well characterized [8-10]. From the data of the quantitative analysis, profiles of protein variation were classified into 5 categories. Proteins which show a simple increase or a simple decrease may participate in a hypothetical mechanism of "biological clock" in the cultured cells.
Proteins, which are up- or down-regulated at the late stage of "phase 2" around 65-74 PDL, may contribute to triggering cells at the "phase 2" to transit into the "phase 3" of replicative aging process at which the rate of cell doubling slows down. The TMIG-2DPAGE database was designed to include all of the quantitative data in it, and to comply with most of rules recommended for building a federated 2-D gel protein database by Appel et al. [12]. We have finished constituting the main frame of TMIG-2DPAGE protein database, from which data of PDL-dependent protein variation of individual spot protein can be accessed by a simple mouse clicking. The development of the database is continued by receiving new entry of data including protein identity. The newest version of the TMIG-2DPAGE protein database is available in our WWW home page anytime. The TMIG-2DPAGE database is expected to be an useful tool to inquire the PDL-dependent variation of specific proteins which is screened out as a candidate for responsible proteins of premature aging diseases such as Werner’s syndrome. We are now performing another research project on the Werner-responsible proteins. The results of the research obtained using the TMIG-2DPAGE database will be soon reported in our separate paper [13].
References
[1] Hayflick, L. and Moorhead, P. S., Exp. Cell Res. 1961, 25, 585-621.
[2] Hayflick, L., Exp. Cell Res. 1965, 37, 614-636.
[3] Harley, C. B., Futcher, A. B. and Greider, C. W., Nature 1990 345, 458-460.
[4] O'Farrell, P. H., J. Biol. Chem., 1975, 250, 4007-4021.
[5] O'Farrell, P. Z., Goodman, H. M. and O’Farrell, P. H., Cell 1977, 12, 1133-1141.
[6] Celis, J. E., Ratz, G. P., Madsen, P., Gesser B., Lauridsen, J. B., Brogaard-Hansen, K. -P., Kwee, S., Rasmussen, H. H., Nielsen, H. V., Cruger, D., Basse, B., Leffers, H., Honore, B., Moller, O. and Celis, A., Electrophoresis 1989, 10, 76-115.
[7] Celis, J. E., Gesser, B., Rasmussen, H. H., Madsen, P., Leffers, H., Dejgaard, K., Honore, B., Olsen, E., Ratz, Lauridsen, J. B., Basse, B., Mouritzen, S., Hellerup, M., Andersen, A., Walbum, E., Celis, A., Bauw, G., Puype, M., Van Damme, J. and Vandekrckhove, J., Electrophoresis 1990, 12, 1072-1113.
[8] Ohashi, M., Aizawa, S., Ooka, H., Ohsawa, T., Kaji, K., Kondo, H., Kobayashi., T., Noumura, T., Matsuo, M., Mitsui, M., Murota, S., Yamamoto, K., Itoh, H., Shimada, H. and Utakoji, T., Exp. Gerontol. 1980, 15, 539-549.
[9] Yoshida, T., Kawase, M., Sasaki, K., Mizusawa, H., Ishidate, M. and Takeuchi, M., Bull. Jpn Fed. Cult. Coll. 1988, 4, 9-15.
[10] Matsuo, M., Kaji, K., Utakoji, T. and Hosoda, K., J. Gerontol. 1982, 37, 33-37.
[11] Toda, T. and Kimura, N., Jpn. J. Electroph. 1997, 41, 13-19.
[12] Appel, R. D., Rairoch, A., Sanchez, J. -C., Vargas, J. R., Golaz, O. and Hochstrasser, D. F., Electrophoresis 1996, 17, 540-546.
[13] Toda, T., Satoh, M., Sugimoto, M., Goto, M., Furuichi, Y. and Kimura, N., Mech. Ageing Dev. 1998, 100, 133-143.
| Discussion Board | Previous Page | Your Symposium |