Invited Symposium: Na-H Exchangers and Intracellular pH Regulation
| INABIS '98 Home Page | Your Session | Symposia & Poster Sessions | Plenary Sessions | Exhibitors' Foyer | Personal Itinerary | New Search |
Results
In fig. 1, we estimated the intravesicular pH by measuring trapped pyranine fluorescence using the "Activated" conditions described in the Methods.
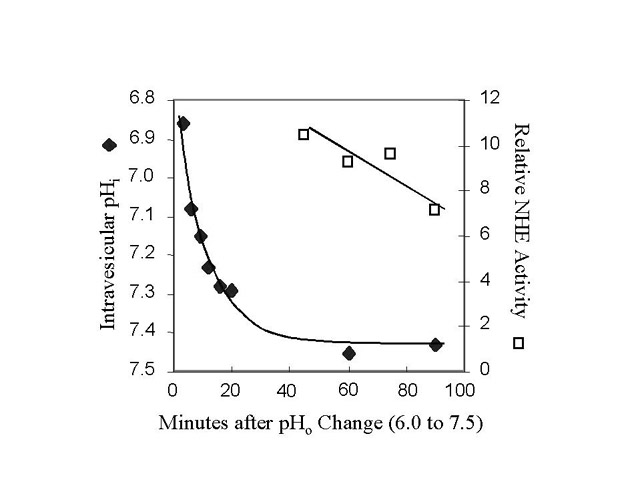 Click to enlargeFig. 1: NHE activation by pH. BBMV were equilibrated at 24oC with pH 6.0 buffer and then diluted into pH 7.5 buffer on ice. Intravesicular pH was estimated by measuring the fluorescent ratio of trapped pyranine, a pH-sensitive dye. NHE activity was measured at the indicated times by diluting the Na+-loaded BBMV (pH 7.5) 100 fold into Na+-free buffer (pH 7.5). The rate of change in acridine orange fluorescence was measured and compared to the activity measured in "Control" BBMV. The trans-membrane pH gradient rapidly dissipated during the first minutes after dilution. Yet the NHE activity remained high in comparison to the NHE activity measured in "Control" BBMV, even after complete dissipation of the initial pH gradient.
At 0oC, the intravesicular pH rapidly became more alkaline and after 60 minutes, the pH was near 7.5. Measurements of NHE activity were made at the same time. We found that "Activated" NHE, 40-90 minutes after returning BBMV to the pH 7.5 buffer, was 6- to 10-fold greater than activity measured in "Control" BBMV, even after complete dissipation of the initial acidification.
The transition from "Activated" to "Control" activity (or the rate of inactivation) was measured in Fig. 2a.
 Click to enlarge Fig. 2a
 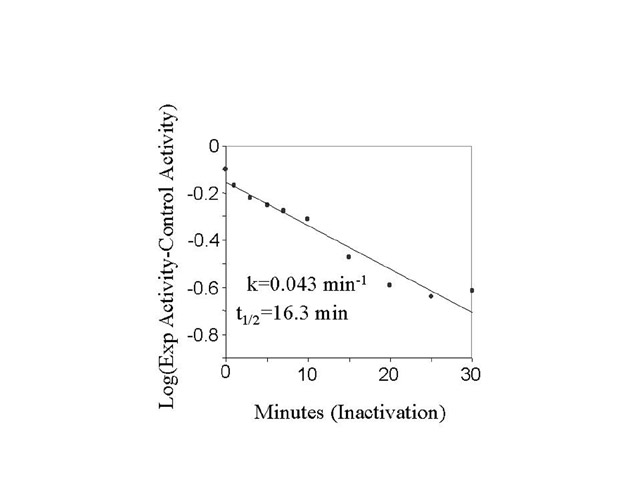 Click to enlarge Fig. 2b
Fig. 2: Rate of NHE inactivation from the active state. BBMV were acid activated (30 minutes, pH 6.0, 24oC followed by 90 minutes, pH 7.5, 0oC). Next, the BBMV, incubated at either 0oC or 20oC for varying periods of time, were assayed for NHE activity. Samples were withdrawn and assayed for NHE activity at the different times shown in Fig. 2a. Fig. 2b is a semilog plot of the data in Fig 2a.
NHE activity was measured in "Activated" BBMV starting 90 minutes after returning acidified membranes to the pH 7.5 buffer. We measured a slow decline in activity over a 2.5 hr period, when the membranes were kept on ice. Some membranes were warmed to 20oC after 90 minutes and the decline in NHE activity was measured over the next 60 minutes. We observed a steady decline in activity relative to "Control" during this period. The 20oC data is presented on a semi-log plot in fig. 2b. Using a single exponential to fit the data, the NHE inactivation rate was 0.043 min-1 (or t1/2 equal to 16.3 min).
The transition from "Control" to "Activated" NHE at 20oC was measured in fig.3a.
 Click to enlarge Fig. 3a
 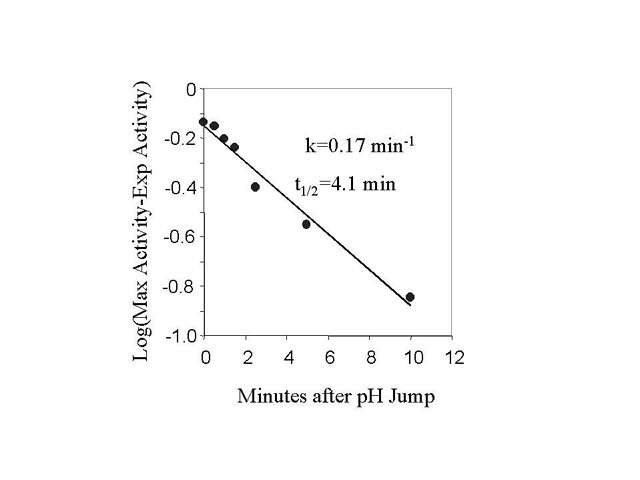 Click to
enlarge Fig. 3b
Click to
enlarge Fig. 3b
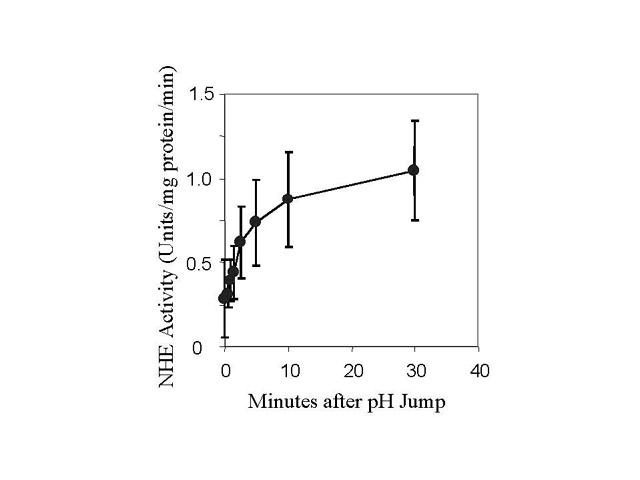
Fig 3. Rate of NHE activation from the inactive state.
Fig. 3a. - BBMV were incubated for different times after the addition of acid
(pH 6.44, 20oC). The BBMV was then returned to pH 7.5 at
0oC as described in Fig. 2 and assayed for activity. Fig. 3b is a
semilog plot of the data in Fig 3a. The l
in Fig 3b are the difference between the activity measured at each time and the
maximum activity measured estimated from data fitting with m-Lab.
Solutions containing 330 mM MES acid and 150 mM NaAcetate (pH6) were added to BBMV at time 0. The final MES and NaAcetate concentration were 9 mM and 4 mM respectively. Under these conditions, the intravesicular pH measured by pyranine fluorescence changed to 6.44 in less than 2 seconds. At various times, the membranes were diluted into ice-cold pH 7.5 solution, centrifuged, and suspended in the same buffer. NHE activity was measured after a minimum of 1 hour in the 7.5 buffer. The rate of increase in NHE activity was plotted on a semi-log plot, fig.3b, fitted by a single exponential function, and found to be 0.17 min-1 (or t1/2 equal to 4.1 min).
These slow rates of activation and inactivation could result from protein phosphorylating or dephosphorylating reactions occurring in the isolated membranes. We found no effect of the kinase inhibitors (1000 nM PPI, 50 nM staurosporine, and 10 m M KN 62) on the activation rate. Both kinase inhibitors and phosphatase inhibitors (10 nM tautomycin, 1 nM okadaic acid, 500 pM cypermethrin, 100m M dephostatin) were without effect on the inactivation rate. These results make it unlikely that activation and inactivation of NHE involve changes in protein phosphorylation.
We next tested if NHE subunits were in close proximity with one another by chemically cross-linking BBMV proteins with glutaraldehyde (0.015% for 5 min at 24oC).
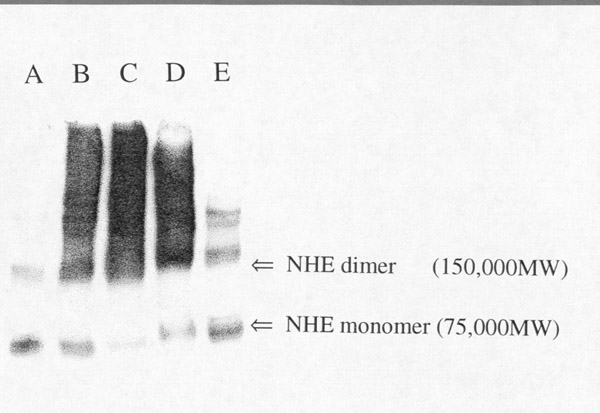 Click to enlargeFig. 4: Cross-linking of NHE with
glutaraldehyde. Proteins (10 m
g) from BBMV after cross-linking treatments were solubilized in SDS under
reducing conditions and separated by PAGE. Protein were transferred to a blot
for western analysis. Anti-NHE3 antibody (13) was used for identification.
(Lane A) is "Control" BBMV without chemical modification. (Lane B) is
"Activated X-link" BBMV, where glutaraldehyde is added to the membrane
vesicles in the presence of an initial pH gradient (pHi=6.0;
pHo=7.5) at 24oC. The reaction is stopped with
NaBH4 after 5 minutes. (Lane C) is "Control" BBMV, where
glutaraldehyde is added to the membrane vesicles in the absence of a pH
gradient. (Lanes D and E) are "Activated" BBMV cross-linked with
disuccinimidyl suberate (D) or Bis(sulfosuccinimidyl) suberate (E). The arrows
on the figure indicate the protomer at approximately 75,000 daltons and higher
molecular weight forms at 150,000 daltons and greater.
Click to enlargeFig. 4: Cross-linking of NHE with
glutaraldehyde. Proteins (10 m
g) from BBMV after cross-linking treatments were solubilized in SDS under
reducing conditions and separated by PAGE. Protein were transferred to a blot
for western analysis. Anti-NHE3 antibody (13) was used for identification.
(Lane A) is "Control" BBMV without chemical modification. (Lane B) is
"Activated X-link" BBMV, where glutaraldehyde is added to the membrane
vesicles in the presence of an initial pH gradient (pHi=6.0;
pHo=7.5) at 24oC. The reaction is stopped with
NaBH4 after 5 minutes. (Lane C) is "Control" BBMV, where
glutaraldehyde is added to the membrane vesicles in the absence of a pH
gradient. (Lanes D and E) are "Activated" BBMV cross-linked with
disuccinimidyl suberate (D) or Bis(sulfosuccinimidyl) suberate (E). The arrows
on the figure indicate the protomer at approximately 75,000 daltons and higher
molecular weight forms at 150,000 daltons and greater.
As shown in fig.4, "Control" BBMV without cross-linking (lane A) showed a prominent band at about 75 kD and other bands at 150 kD and above. BBMV protein cross-linking in the presence of a pH gradient (lane B) or in the absence of a pH gradient (lane C) shifted the apparent molecular weight from 75 kD to higher molecular weights. The pattern was the same for both cross-linking conditions, suggesting that NHE monomers are closely associated with each other in the membrane. NHE activation by acid did not promote further physical association of the subunits into an oligomer suggesting that the oligomer is present under all conditions. DSS (disuccinimidyl suberate) cross-linking produced the same pattern as glutaraldehyde (lane D), while BS3 (bis(sulfosuccinimidyl) suberate) treatment resulted in less inter-subunit cross-linking (lane D). We conclude that pH-dependent activation and inactivation are likely caused by protein conformational changes that induce functional coupling of the NHE subunits. Chemically cross-linking of other proteins to NHE will cause shifts in the molecular weight and should be considered as a possible explanation for the change in apparent molecular weight described above.
| <= Materials & Methods | RESULTS | Discussion & Conclussions => |
| Discussion Board | Next Page | Your Symposium |